TITAN V 在 超级品质 质量设置下使用 FX-8320 基准

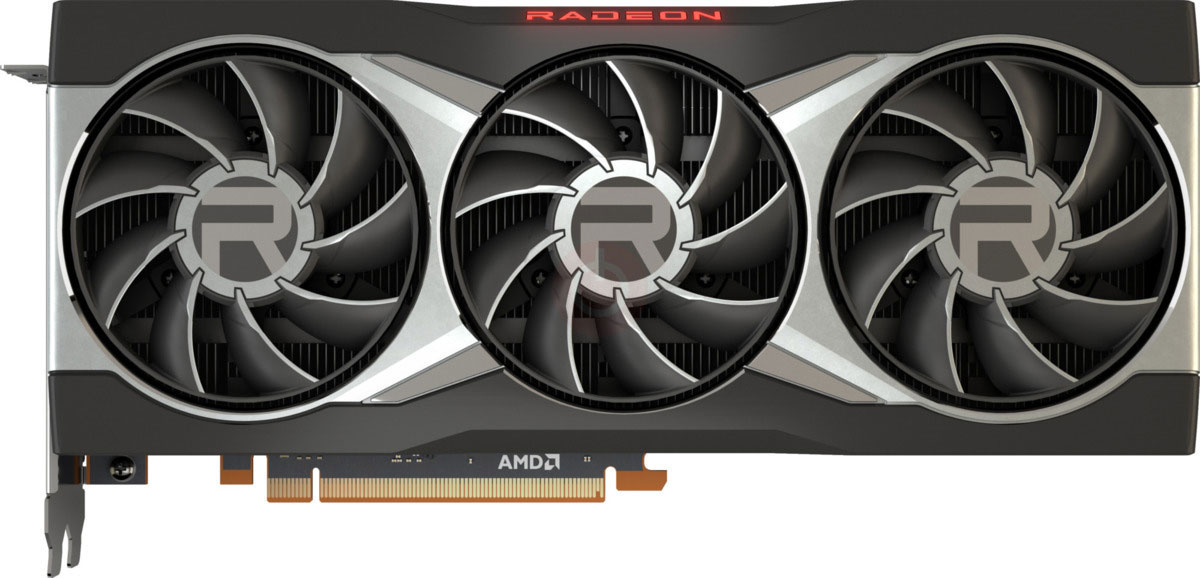
在成本方面,定价显然是一个真正的问题, TITAN V 的价格简直荒谬。 对于那些使用1080p甚至1440p显示器的人来说, TITAN V 非常昂贵,短期内有更好的价值选择。 值得注意的是, TITAN V 是一个非常耗电的卡,需要一个像样的电源单元。 在内存方面, TITAN V 的 12288 MB RAM对现代游戏来说已经绰绰有余,不应该造成任何瓶颈。 TITAN V 和 AMD FX-8320 Eight-Core 之间的这种组合将在许多游戏中造成严重的瓶颈并导致严重的FPS损失。 4K游戏在这个 TITAN V 上很开心,并且稍微调整一下你的AA设置,很难想象一个标题平均不能达到60 fps。

 TITAN V 在 超级品质 质量设置下使用 FX-8320 基准
NVIDIA TITAN V
价钱 ¥ 20,783.1
2017
最高记录温度 84C
最大风扇噪音 50.5dB
推荐电源 600W
基准CPU AMD FX-8320 Eight-Core ($79.5)
CPU对FPS的影响 -44.8 FPS
CPU对FPS的影响% -30.0%
基准质量设置 Ultra Quality Settings
平均1080p性能 95.1 FPS
平均1440p表现 72.8 FPS
(Ultrawide) 平均1440p表现 63.2 FPS
平均4K性能 45.4 FPS
记忆 12 GB
每帧1080p成本 ¥ 218.6
1440p每帧成本 ¥ 285.5
(Ultrawide) 1440p每帧成本 ¥ 328.8
每帧4K成本 ¥ 457.8
系列 TITAN V
Variant NVIDIA TITAN V
总体组合分数 59/100 可接受

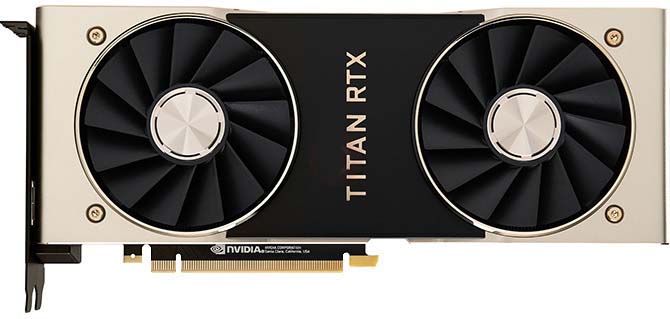
规范的规范,这个 TITAN V 通过吹嘘 11.2 %fps来超越它的直接前身 TITAN Xp 。 幸运的是,游戏性能令人印象深刻。 TITAN V 始终比 TITAN Xp 提供更高的帧速率,并且它确实有理由进行升级。

对于 1080p Full HD ,我们能够以 61 fps到 68 fps玩 Forspoken, Star Wars Jedi: Survivor, Atomic Heart, Halo Infinite, Assassin's Creed Valhalla , 保持帧率在 63 fps附近徘徊。 对于 1440p Quad HD ,我们能够以 62 fps到 66 fps玩 Marvel's Avengers, Total War: Warhammer III, Metro Exodus, Cyberpunk 2077, Borderlands 3 , 保持帧率在 63 fps附近徘徊。

对于 2160p 4K ,我们能够以 60 fps到 63 fps玩 Resident Evil 2, Far Cry 5, Resident Evil 4, Far Cry New Dawn, Death Stranding , 保持帧率在 62 fps附近徘徊。

Assassin's Creed Valhalla (2020)

超级品质

解析度 1920x1080

显卡 价钱 每秒帧数
2020 AMD Radeon RX 6800 ¥ 4,013
90.6 FPS
2018 NVIDIA TITAN RTX ¥ 17,318
83.6 FPS
2020 NVIDIA GeForce RTX 3070 ¥ 3,458
82.5 FPS
2018 NVIDIA GeForce RTX 2080 Ti ¥ 9,002
80.0 FPS
2020 NVIDIA GeForce RTX 3060 Ti ¥ 2,765
71.4 FPS
2019 NVIDIA GeForce RTX 2080 SUPER ¥ 4,844
69.0 FPS
2017 NVIDIA TITAN V ¥ 20,783
44.0 FPS
2018 NVIDIA GeForce RTX 2080 ¥ 4,844
63.9 FPS
2019 NVIDIA GeForce RTX 2070 SUPER ¥ 3,458
60.0 FPS
2017 NVIDIA GeForce GTX 1080 Ti ¥ 5,260
58.6 FPS
2017 NVIDIA TITAN Xp ¥ 8,309
57.8 FPS
2019 AMD Radeon VII ¥ 4,844
56.3 FPS
2018 NVIDIA GeForce RTX 2070 ¥ 3,458
56.0 FPS
2019 AMD Radeon RX 5700 XT ¥ 2,765
55.5 FPS
2019 AMD Radeon RX 5700 ¥ 2,419
51.4 FPS
2019 NVIDIA GeForce RTX 2060 SUPER ¥ 2,772
51.2 FPS
2016 NVIDIA GeForce GTX 1080 ¥ 3,458
48.9 FPS
2020 AMD Radeon RX 5600 XT ¥ 1,934
47.6 FPS
2019 NVIDIA GeForce RTX 2060 ¥ 2,426
47.4 FPS
2017 AMD Radeon RX Vega 64 ¥ 3,458
46.7 FPS
2017 NVIDIA GeForce GTX 1070 Ti ¥ 2,834
46.3 FPS
2017 AMD Radeon RX Vega 56 ¥ 2,765
45.2 FPS
2015 NVIDIA GeForce GTX TITAN X ¥ 6,923
45.0 FPS
2019 NVIDIA GeForce GTX 1660 Ti ¥ 1,934
44.5 FPS
2014 AMD Radeon R9 295X2 ¥ 10,388
44.3 FPS
2016 NVIDIA GeForce GTX 1070 ¥ 2,765
43.0 FPS
2019 NVIDIA GeForce GTX 1660 SUPER ¥ 1,587
42.8 FPS
2019 NVIDIA GeForce GTX 1660 ¥ 1,525
41.3 FPS
2015 NVIDIA GeForce GTX 980 Ti ¥ 4,498
35.2 FPS
2015 AMD Radeon R9 FURY X ¥ 4,498
34.6 FPS
2018 AMD Radeon RX 590 ¥ 1,934
34.3 FPS
2015 AMD Radeon R9 Nano ¥ 4,498
32.6 FPS
2019 AMD Radeon RX 5500 XT 8GB ¥ 1,379
31.9 FPS
2014 NVIDIA GeForce GTX 980 ¥ 3,805
31.9 FPS
2017 AMD Radeon RX 580 ¥ 1,587
29.9 FPS
2019 NVIDIA GeForce GTX 1650 SUPER ¥ 1,109
29.6 FPS

TITAN V 位于 RTX 2080 SUPER 和 RTX 2080 ,慢于 RTX 2080 SUPER 2.2 %,比 RTX 2080 5.6 %。 它在这里对每一块显卡都有很强的相对性能。 其结果实际上与 RTX 2080 SUPER 结果无法区分。

Forza Horizon 4 (2018)

超级品质

解析度 1920x1080

显卡 价钱 每秒帧数
2020 NVIDIA GeForce RTX 3070 ¥ 3,458
189.0 FPS
2020 AMD Radeon RX 6800 ¥ 4,013
176.0 FPS
2017 NVIDIA TITAN Xp ¥ 8,309
160.1 FPS
2018 NVIDIA TITAN RTX ¥ 17,318
156.5 FPS
2018 NVIDIA GeForce RTX 2080 Ti ¥ 9,002
152.7 FPS
2020 NVIDIA GeForce RTX 3060 Ti ¥ 2,765
147.9 FPS
2019 NVIDIA GeForce RTX 2080 SUPER ¥ 4,844
144.0 FPS
2018 NVIDIA GeForce RTX 2080 ¥ 4,844
139.0 FPS
2017 NVIDIA GeForce GTX 1080 Ti ¥ 5,260
135.0 FPS
2017 NVIDIA TITAN V ¥ 20,783
86.8 FPS
2019 NVIDIA GeForce RTX 2070 SUPER ¥ 3,458
132.0 FPS
2018 NVIDIA GeForce RTX 2070 ¥ 3,458
125.0 FPS
2019 NVIDIA GeForce RTX 2060 SUPER ¥ 2,772
121.0 FPS
2016 NVIDIA GeForce GTX 1080 ¥ 3,458
117.0 FPS
2019 AMD Radeon VII ¥ 4,844
113.7 FPS
2019 NVIDIA GeForce RTX 2060 ¥ 2,426
111.1 FPS
2019 AMD Radeon RX 5700 XT ¥ 2,765
109.7 FPS
2017 NVIDIA GeForce GTX 1070 Ti ¥ 2,834
105.0 FPS
2019 AMD Radeon RX 5700 ¥ 2,419
100.8 FPS
2015 NVIDIA GeForce GTX TITAN X ¥ 6,923
100.0 FPS
2019 NVIDIA GeForce GTX 1660 Ti ¥ 1,934
99.8 FPS
2020 AMD Radeon RX 5600 XT ¥ 1,934
99.0 FPS
2016 NVIDIA GeForce GTX 1070 ¥ 2,765
96.0 FPS
2019 NVIDIA GeForce GTX 1660 SUPER ¥ 1,587
94.0 FPS
2015 NVIDIA GeForce GTX 980 Ti ¥ 4,498
94.0 FPS
2017 AMD Radeon RX Vega 64 ¥ 3,458
91.0 FPS
2017 AMD Radeon RX Vega 56 ¥ 2,765
89.0 FPS
2019 NVIDIA GeForce GTX 1660 ¥ 1,525
87.8 FPS
2018 AMD Radeon RX 590 ¥ 1,934
75.5 FPS
2019 NVIDIA GeForce GTX 1650 SUPER ¥ 1,109
74.5 FPS
2014 NVIDIA GeForce GTX 980 ¥ 3,805
73.0 FPS
2019 AMD Radeon RX 5500 XT 8GB ¥ 1,379
69.7 FPS
2017 AMD Radeon RX 580 ¥ 1,587
68.2 FPS
2015 AMD Radeon R9 FURY X ¥ 4,498
68.0 FPS
2015 AMD Radeon R9 Nano ¥ 4,498
63.0 FPS

TITAN V 位于 GTX 1080 Ti 和 RTX 2070 SUPER ,慢于 GTX 1080 Ti 1.4 %,比 RTX 2070 SUPER 0.8 %。 它具有与此处每个图形卡相对的平均相对性能。 其结果实际上与 GTX 1080 Ti 结果无法区分。

Cyberpunk 2077 (2020)

超级品质

解析度 1920x1080

显卡 价钱 每秒帧数
2020 AMD Radeon RX 6800 ¥ 4,013
90.6 FPS
2018 NVIDIA TITAN RTX ¥ 17,318
83.6 FPS
2020 NVIDIA GeForce RTX 3070 ¥ 3,458
82.5 FPS
2018 NVIDIA GeForce RTX 2080 Ti ¥ 9,002
80.0 FPS
2020 NVIDIA GeForce RTX 3060 Ti ¥ 2,765
69.8 FPS
2019 NVIDIA GeForce RTX 2080 SUPER ¥ 4,844
69.0 FPS
2017 NVIDIA TITAN V ¥ 20,783
44.0 FPS
2018 NVIDIA GeForce RTX 2080 ¥ 4,844
63.9 FPS
2019 NVIDIA GeForce RTX 2070 SUPER ¥ 3,458
60.0 FPS
2017 NVIDIA GeForce GTX 1080 Ti ¥ 5,260
58.6 FPS
2017 NVIDIA TITAN Xp ¥ 8,309
57.8 FPS
2019 AMD Radeon VII ¥ 4,844
56.3 FPS
2018 NVIDIA GeForce RTX 2070 ¥ 3,458
56.0 FPS
2019 AMD Radeon RX 5700 XT ¥ 2,765
55.5 FPS
2019 AMD Radeon RX 5700 ¥ 2,419
51.4 FPS
2019 NVIDIA GeForce RTX 2060 SUPER ¥ 2,772
51.2 FPS
2016 NVIDIA GeForce GTX 1080 ¥ 3,458
48.9 FPS
2020 AMD Radeon RX 5600 XT ¥ 1,934
47.6 FPS
2019 NVIDIA GeForce RTX 2060 ¥ 2,426
47.4 FPS
2017 AMD Radeon RX Vega 64 ¥ 3,458
46.7 FPS
2017 NVIDIA GeForce GTX 1070 Ti ¥ 2,834
46.3 FPS
2017 AMD Radeon RX Vega 56 ¥ 2,765
45.2 FPS
2015 NVIDIA GeForce GTX TITAN X ¥ 6,923
45.0 FPS
2019 NVIDIA GeForce GTX 1660 Ti ¥ 1,934
44.5 FPS
2014 AMD Radeon R9 295X2 ¥ 10,388
44.3 FPS
2016 NVIDIA GeForce GTX 1070 ¥ 2,765
43.0 FPS
2019 NVIDIA GeForce GTX 1660 SUPER ¥ 1,587
42.8 FPS
2019 NVIDIA GeForce GTX 1660 ¥ 1,525
41.3 FPS
2015 NVIDIA GeForce GTX 980 Ti ¥ 4,498
35.2 FPS
2015 AMD Radeon R9 FURY X ¥ 4,498
34.6 FPS
2018 AMD Radeon RX 590 ¥ 1,934
34.3 FPS
2015 AMD Radeon R9 Nano ¥ 4,498
32.6 FPS
2019 AMD Radeon RX 5500 XT 8GB ¥ 1,379
31.9 FPS
2014 NVIDIA GeForce GTX 980 ¥ 3,805
31.9 FPS
2017 AMD Radeon RX 580 ¥ 1,587
29.9 FPS
2019 NVIDIA GeForce GTX 1650 SUPER ¥ 1,109
29.6 FPS

TITAN V 位于 RTX 2080 SUPER 和 RTX 2080 ,慢于 RTX 2080 SUPER 2.2 %,比 RTX 2080 5.6 %。 它在这里对每一块显卡都有很强的相对性能。 其结果实际上与 RTX 2080 SUPER 结果无法区分。

Grand Theft Auto V (2015)

超级品质

解析度 1920x1080

显卡 价钱 每秒帧数
2020 NVIDIA GeForce RTX 3070 ¥ 3,458
171.0 FPS
2020 AMD Radeon RX 6800 ¥ 4,013
161.3 FPS
2017 NVIDIA TITAN Xp ¥ 8,309
152.7 FPS
2018 NVIDIA TITAN RTX ¥ 17,318
147.8 FPS
2018 NVIDIA GeForce RTX 2080 Ti ¥ 9,002
144.3 FPS
2020 NVIDIA GeForce RTX 3060 Ti ¥ 2,765
140.8 FPS
2019 NVIDIA GeForce RTX 2080 SUPER ¥ 4,844
137.0 FPS
2018 NVIDIA GeForce RTX 2080 ¥ 4,844
132.6 FPS
2017 NVIDIA GeForce GTX 1080 Ti ¥ 5,260
129.1 FPS
2019 NVIDIA GeForce RTX 2070 SUPER ¥ 3,458
126.0 FPS
2017 NVIDIA TITAN V ¥ 20,783
82.0 FPS
2018 NVIDIA GeForce RTX 2070 ¥ 3,458
120.0 FPS
2016 NVIDIA GeForce GTX 1080 ¥ 3,458
111.4 FPS
2019 NVIDIA GeForce RTX 2060 SUPER ¥ 2,772
110.0 FPS
2019 NVIDIA GeForce RTX 2060 ¥ 2,426
107.3 FPS
2019 AMD Radeon VII ¥ 4,844
104.6 FPS
2019 AMD Radeon RX 5700 XT ¥ 2,765
100.7 FPS
2017 NVIDIA GeForce GTX 1070 Ti ¥ 2,834
100.1 FPS
2014 AMD Radeon R9 295X2 ¥ 10,388
96.9 FPS
2019 NVIDIA GeForce GTX 1660 Ti ¥ 1,934
95.1 FPS
2016 NVIDIA GeForce GTX 1070 ¥ 2,765
92.7 FPS
2019 AMD Radeon RX 5700 ¥ 2,419
92.4 FPS
2020 AMD Radeon RX 5600 XT ¥ 1,934
89.0 FPS
2019 NVIDIA GeForce GTX 1660 SUPER ¥ 1,587
89.0 FPS
2017 AMD Radeon RX Vega 64 ¥ 3,458
83.7 FPS
2019 NVIDIA GeForce GTX 1660 ¥ 1,525
83.7 FPS
2017 AMD Radeon RX Vega 56 ¥ 2,765
83.6 FPS
2015 NVIDIA GeForce GTX TITAN X ¥ 6,923
82.4 FPS
2015 NVIDIA GeForce GTX 980 Ti ¥ 4,498
80.0 FPS
2015 AMD Radeon R9 FURY X ¥ 4,498
70.0 FPS
2019 NVIDIA GeForce GTX 1650 SUPER ¥ 1,109
68.3 FPS
2018 AMD Radeon RX 590 ¥ 1,934
66.4 FPS
2014 NVIDIA GeForce GTX 980 ¥ 3,805
65.7 FPS
2015 AMD Radeon R9 Nano ¥ 4,498
62.1 FPS
2019 AMD Radeon RX 5500 XT 8GB ¥ 1,379
61.1 FPS
2017 AMD Radeon RX 580 ¥ 1,587
60.0 FPS

TITAN V 位于 RTX 2070 SUPER 和 RTX 2070 ,慢于 RTX 2070 SUPER 0.2 %,比 RTX 2070 4.8 %。 它具有与此处每个图形卡相对的平均相对性能。 其结果实际上与 RTX 2070 SUPER 结果无法区分。

Call of Duty Modern Warfare (2019)

超级品质

解析度 1920x1080

显卡 价钱 每秒帧数
2020 AMD Radeon RX 6800 ¥ 4,013
237.4 FPS
2018 NVIDIA TITAN RTX ¥ 17,318
223.0 FPS
2020 NVIDIA GeForce RTX 3070 ¥ 3,458
219.0 FPS
2018 NVIDIA GeForce RTX 2080 Ti ¥ 9,002
213.2 FPS
2020 NVIDIA GeForce RTX 3060 Ti ¥ 2,765
189.7 FPS
2019 NVIDIA GeForce RTX 2080 SUPER ¥ 4,844
184.0 FPS
2017 NVIDIA TITAN V ¥ 20,783
117.4 FPS
2018 NVIDIA GeForce RTX 2080 ¥ 4,844
170.4 FPS
2019 NVIDIA GeForce RTX 2070 SUPER ¥ 3,458
159.0 FPS
2017 NVIDIA GeForce GTX 1080 Ti ¥ 5,260
156.3 FPS
2017 NVIDIA TITAN Xp ¥ 8,309
154.0 FPS
2019 AMD Radeon VII ¥ 4,844
150.0 FPS
2019 AMD Radeon RX 5700 XT ¥ 2,765
148.0 FPS
2018 NVIDIA GeForce RTX 2070 ¥ 3,458
148.0 FPS
2019 AMD Radeon RX 5700 ¥ 2,419
137.0 FPS
2019 NVIDIA GeForce RTX 2060 SUPER ¥ 2,772
136.5 FPS
2016 NVIDIA GeForce GTX 1080 ¥ 3,458
130.3 FPS
2020 AMD Radeon RX 5600 XT ¥ 1,934
127.0 FPS
2019 NVIDIA GeForce RTX 2060 ¥ 2,426
126.5 FPS
2017 AMD Radeon RX Vega 64 ¥ 3,458
124.5 FPS
2017 NVIDIA GeForce GTX 1070 Ti ¥ 2,834
123.5 FPS
2017 AMD Radeon RX Vega 56 ¥ 2,765
120.5 FPS
2015 NVIDIA GeForce GTX TITAN X ¥ 6,923
120.0 FPS
2019 NVIDIA GeForce GTX 1660 Ti ¥ 1,934
118.6 FPS
2014 AMD Radeon R9 295X2 ¥ 10,388
118.0 FPS
2016 NVIDIA GeForce GTX 1070 ¥ 2,765
114.7 FPS
2019 NVIDIA GeForce GTX 1660 SUPER ¥ 1,587
114.0 FPS
2019 NVIDIA GeForce GTX 1660 ¥ 1,525
110.0 FPS
2019 NVIDIA GeForce GTX 1650 SUPER ¥ 1,109
94.5 FPS
2015 NVIDIA GeForce GTX 980 Ti ¥ 4,498
93.8 FPS
2015 AMD Radeon R9 FURY X ¥ 4,498
92.2 FPS
2018 AMD Radeon RX 590 ¥ 1,934
91.5 FPS
2015 AMD Radeon R9 Nano ¥ 4,498
87.0 FPS
2014 NVIDIA GeForce GTX 980 ¥ 3,805
85.0 FPS
2019 AMD Radeon RX 5500 XT 8GB ¥ 1,379
82.4 FPS
2017 AMD Radeon RX 580 ¥ 1,587
79.7 FPS

TITAN V 位于 RTX 2080 SUPER 和 RTX 2080 ,慢于 RTX 2080 SUPER 2.2 %,比 RTX 2080 5.6 %。 它在这里对每一块显卡都有很强的相对性能。 其结果实际上与 RTX 2080 SUPER 结果无法区分。

超级品质 设置下的游戏性能

更改质量设置

解析度 1920x1080

1% Low [Min FPS] Average FPS
游戏 每秒帧数
2023 Resident Evil 4
48
75.0
2023 A Plague Tale: Requiem
33
51.1
2023 Hogwarts Legacy
28
44.3
2023 The Last of Us Part I
22
34.1
2023 Forspoken
25
39.5
2023 The Callisto Protocol
20
30.7
2023 Dead Space
33
51.1
2023 Baldur's Gate 3
39
60.7
2023 Armored Core VI
39
60.7
2023 Immortals of Aveum
17
27.3
2023 Ratchet and Clank Rift Apart
35
54.6
2023 Remnant II
20
30.7
2023 Star Wars Jedi: Survivor
26
40.9
2023 Atomic Heart
26
40.9
2023 Starfield
13
20.5
2022 Elden Ring
37
56.9
2022 God of War
35
54.0
2022 Overwatch 2
65
100.4
2022 F1 22
40
61.4
2022 Dying Light 2
37
58.0
2022 Total War: Warhammer III
37
58.0
2022 Spider-Man Remastered
62
95.5
2022 Call of Duty: Modern Warfare II
44
68.2
2021 Forza Horizon 5
35
54.6
2021 Halo Infinite
27
41.7
2021 Battlefield 2042
50
76.9
2021 Hitman 3
51
78.5
2021 Far Cry 6
47
73.0
2021 Guardians of the Galaxy
52
79.8
2020 Watch Dogs: Legion
52
80.5
2020 Assassin's Creed Valhalla
28
44.0
2020 Microsoft Flight Simulator
18
28.8
2020 Valorant
125
193.1
2020 Call of Duty: Black Ops Cold War
49
75.7
2020 Death Stranding
57
87.5
2020 Marvel's Avengers
37
56.9
2020 Godfall
55
85.1
2020 Cyberpunk 2077
28
44.0
2019 Apex Legends
68
105.7
2019 Anthem
44
68.1
2019 Far Cry New Dawn
65
99.8
2019 Resident Evil 2
77
118.6
2019 Metro Exodus
34
52.8
2019 World War Z
66
102.4
2019 Gears of War 5
50
76.9
2019 F1 2019
62
96.5
2019 GreedFall
56
86.9
2019 Borderlands 3
39
61.0
2019 Call of Duty Modern Warfare
76
117.4
2019 Red Dead Redemption 2
29
45.2
2019 Need For Speed: Heat
46
71.0
2018 Call of Duty: Black Ops 4
75
115.3
2018 F1 2018
61
93.9
2018 Far Cry 5
41
64.1
2018 Assassin's Creed Odyssey
30
46.4
2018 Final Fantasy XV
52
80.2
2018 Shadow of the Tomb Raider
50
78.0
2018 Forza Horizon 4
56
86.8
2018 Fallout 76
60
92.8
2018 Hitman 2
47
72.2
2018 Just Cause 4
49
76.3
2018 Monster Hunter: World
53
82.2
2018 Strange Brigade
80
123.8
2018 Battlefield V
69
106.0
2017 Assassin's Creed Origins
44
68.7
2017 Shadow of War
53
81.4
2017 Total War: Warhammer II
44
67.7
2017 Wolfenstein II
99
152.5
2017 Destiny 2
85
131.0
2017 PlayerUnknown's Battlegrounds
45
69.9
2017 Fortnite Battle Royale
56
86.8
2017 Need For Speed: Payback
68
105.7
2017 For Honor
91
140.9
2017 Project CARS 2
65
99.8
2017 Forza Motorsport 7
78
120.9
2016 Ashes of the Singularity: Escalation
44
68.9
2016 Battlefield 1
61
94.2
2016 Overwatch
87
134.5
2016 Dishonored 2
47
72.8
2015 Grand Theft Auto V
53
82.0
2015 Rocket League
267
410.9
2015 Need For Speed
74
113.9
2015 Project CARS
71
109.2
2015 Rainbow Six Siege
130
199.6
2012 Counter-Strike: Global Offensive
183
281.7
2009 League of Legends
344
528.3

解析度 2560x1440

1% Low [Min FPS] Average FPS
游戏 每秒帧数
2023 Resident Evil 4
35
54.6
2023 A Plague Tale: Requiem
24
37.5
2023 Hogwarts Legacy
22
34.1
2023 The Last of Us Part I
16
25.9
2023 Forspoken
16
25.9
2023 The Callisto Protocol
14
21.8
2023 Dead Space
22
34.1
2023 Baldur's Gate 3
32
49.1
2023 Armored Core VI
32
49.1
2023 Immortals of Aveum
12
19.1
2023 Ratchet and Clank Rift Apart
24
37.5
2023 Remnant II
13
20.5
2023 Star Wars Jedi: Survivor
20
30.7
2023 Atomic Heart
19
29.3
2023 Starfield
12
18.4
2022 Elden Ring
29
44.9
2022 God of War
30
46.4
2022 Overwatch 2
56
86.3
2022 F1 22
24
37.5
2022 Dying Light 2
24
37.5
2022 Total War: Warhammer III
26
40.9
2022 Spider-Man Remastered
44
68.2
2022 Call of Duty: Modern Warfare II
28
44.3
2021 Forza Horizon 5
30
47.0
2021 Halo Infinite
24
37.6
2021 Battlefield 2042
33
51.1
2021 Hitman 3
36
55.9
2021 Far Cry 6
35
54.6
2021 Guardians of the Galaxy
36
56.6
2020 Watch Dogs: Legion
34
52.5
2020 Assassin's Creed Valhalla
24
38.2
2020 Microsoft Flight Simulator
16
25.2
2020 Valorant
102
157.9
2020 Call of Duty: Black Ops Cold War
38
59.3
2020 Death Stranding
44
67.8
2020 Marvel's Avengers
26
40.5
2020 Godfall
37
56.9
2020 Cyberpunk 2077
26
41.1
2019 Apex Legends
51
78.7
2019 Anthem
35
54.0
2019 Far Cry New Dawn
50
77.5
2019 Resident Evil 2
52
79.8
2019 Metro Exodus
26
41.1
2019 World War Z
48
74.7
2019 Gears of War 5
36
55.8
2019 F1 2019
44
68.3
2019 GreedFall
40
62.8
2019 Borderlands 3
27
42.8
2019 Call of Duty Modern Warfare
55
84.5
2019 Red Dead Redemption 2
24
37.0
2019 Need For Speed: Heat
36
55.8
2018 Call of Duty: Black Ops 4
52
79.8
2018 F1 2018
55
85.5
2018 Far Cry 5
41
62.9
2018 Assassin's Creed Odyssey
24
37.3
2018 Final Fantasy XV
38
59.1
2018 Shadow of the Tomb Raider
39
60.6
2018 Forza Horizon 4
47
72.8
2018 Fallout 76
57
87.9
2018 Hitman 2
30
47.2
2018 Just Cause 4
36
56.3
2018 Monster Hunter: World
37
57.5
2018 Strange Brigade
56
86.3
2018 Battlefield V
53
82.7
2017 Assassin's Creed Origins
35
54.2
2017 Shadow of War
42
64.9
2017 Total War: Warhammer II
36
56.4
2017 Wolfenstein II
75
116.0
2017 Destiny 2
73
112.4
2017 PlayerUnknown's Battlegrounds
34
53.6
2017 Fortnite Battle Royale
36
56.3
2017 Need For Speed: Payback
49
76.3
2017 For Honor
53
82.2
2017 Project CARS 2
45
70.4
2017 Forza Motorsport 7
71
109.2
2016 Ashes of the Singularity: Escalation
39
60.3
2016 Battlefield 1
59
90.7
2016 Overwatch
60
92.9
2016 Dishonored 2
40
62.2
2015 Grand Theft Auto V
45
69.2
2015 Rocket League
114
176.1
2015 Need For Speed
57
88.0
2015 Project CARS
54
83.3
2015 Rainbow Six Siege
84
129.1
2012 Counter-Strike: Global Offensive
153
234.8
2009 League of Legends
191
293.5

解析度 3440x1440

1% Low [Min FPS] Average FPS
游戏 每秒帧数
2019 Apex Legends
43
67.2
2019 Anthem
29
44.6
2019 Far Cry New Dawn
41
63.5
2019 Resident Evil 2
41
63.7
2019 Metro Exodus
23
35.8
2019 World War Z
41
63.0
2019 Gears of War 5
31
48.7
2019 F1 2019
39
59.8
2019 GreedFall
30
47.4
2019 Borderlands 3
22
34.8
2019 Call of Duty Modern Warfare
47
72.2
2019 Red Dead Redemption 2
21
32.3
2019 Need For Speed: Heat
31
48.7
2018 Call of Duty: Black Ops 4
42
65.4
2018 F1 2018
49
76.1
2018 Far Cry 5
36
55.4
2018 Assassin's Creed Odyssey
22
34.0
2018 Final Fantasy XV
32
49.7
2018 Shadow of the Tomb Raider
33
50.8
2018 Forza Horizon 4
42
64.8
2018 Fallout 76
47
72.9
2018 Hitman 2
26
40.2
2018 Just Cause 4
29
45.8
2018 Monster Hunter: World
29
45.5
2018 Strange Brigade
46
71.3
2018 Battlefield V
45
70.4
2017 Assassin's Creed Origins
31
47.7
2017 Shadow of War
37
56.9
2017 Total War: Warhammer II
30
47.5
2017 Wolfenstein II
65
100.0
2017 Destiny 2
58
90.3
2017 PlayerUnknown's Battlegrounds
29
44.9
2017 Fortnite Battle Royale
30
46.4
2017 Need For Speed: Payback
45
69.1
2017 For Honor
42
65.9
2017 Project CARS 2
45
69.1
2017 Forza Motorsport 7
70
107.4
2016 Ashes of the Singularity: Escalation
40
61.6
2016 Battlefield 1
52
80.3
2016 Overwatch
49
75.3
2016 Dishonored 2
38
59.7
2015 Grand Theft Auto V
37
57.8
2015 Rocket League
90
138.2
2015 Need For Speed
51
78.5
2015 Project CARS
49
76.0
2015 Rainbow Six Siege
65
101.1
2012 Counter-Strike: Global Offensive
155
238.6
2009 League of Legends
143
219.8

解析度 3840x2160

1% Low [Min FPS] Average FPS
游戏 每秒帧数
2023 Resident Evil 4
26
40.9
2023 A Plague Tale: Requiem
15
23.9
2023 Hogwarts Legacy
15
23.9
2023 The Last of Us Part I
8
13.6
2023 Forspoken
8
12.3
2023 The Callisto Protocol
7
10.9
2023 Dead Space
8
13.6
2023 Baldur's Gate 3
17
27.3
2023 Armored Core VI
17
27.3
2023 Immortals of Aveum
5
8.9
2023 Ratchet and Clank Rift Apart
13
20.5
2023 Remnant II
6
10.2
2023 Star Wars Jedi: Survivor
9
15.0
2023 Atomic Heart
12
18.4
2023 Starfield
8
12.3
2022 Elden Ring
16
25.6
2022 God of War
23
36.1
2022 Overwatch 2
42
65.2
2022 F1 22
17
27.3
2022 Dying Light 2
17
27.3
2022 Total War: Warhammer III
20
30.7
2022 Spider-Man Remastered
31
47.7
2022 Call of Duty: Modern Warfare II
17
27.3
2021 Forza Horizon 5
23
36.4
2021 Halo Infinite
16
25.8
2021 Battlefield 2042
21
32.9
2021 Hitman 3
22
34.1
2021 Far Cry 6
19
29.3
2021 Guardians of the Galaxy
20
30.7
2020 Watch Dogs: Legion
22
34.1
2020 Assassin's Creed Valhalla
16
25.8
2020 Microsoft Flight Simulator
13
20.0
2020 Valorant
89
137.3
2020 Call of Duty: Black Ops Cold War
20
31.7
2020 Death Stranding
26
41.2
2020 Marvel's Avengers
13
21.3
2020 Godfall
17
27.1
2020 Cyberpunk 2077
17
27.0
2019 Apex Legends
30
47.0
2019 Anthem
19
29.3
2019 Far Cry New Dawn
26
41.1
2019 Resident Evil 2
25
39.3
2019 Metro Exodus
16
25.8
2019 World War Z
28
43.0
2019 Gears of War 5
22
35.2
2019 F1 2019
28
43.4
2019 GreedFall
16
25.8
2019 Borderlands 3
14
22.3
2019 Call of Duty Modern Warfare
32
50.5
2019 Red Dead Redemption 2
15
23.5
2019 Need For Speed: Heat
22
35.2
2018 Call of Duty: Black Ops 4
27
42.5
2018 F1 2018
36
56.7
2018 Far Cry 5
26
40.8
2018 Assassin's Creed Odyssey
17
26.2
2018 Final Fantasy XV
22
33.9
2018 Shadow of the Tomb Raider
22
34.4
2018 Forza Horizon 4
31
48.3
2018 Fallout 76
31
48.3
2018 Hitman 2
18
28.0
2018 Just Cause 4
19
29.3
2018 Monster Hunter: World
18
27.6
2018 Strange Brigade
30
47.0
2018 Battlefield V
31
48.9
2017 Ghost Recon Wildlands
23
36.7
2017 Assassin's Creed Origins
22
34.9
2017 Shadow of War
27
41.5
2017 Total War: Warhammer II
21
32.3
2017 Wolfenstein II
46
71.0
2017 Destiny 2
36
56.5
2017 PlayerUnknown's Battlegrounds
19
30.3
2017 Fortnite Battle Royale
19
30.6
2017 Need For Speed: Payback
34
52.8
2017 For Honor
26
41.1
2017 Project CARS 2
38
58.7
2017 Forza Motorsport 7
59
91.6
2016 Deus Ex: Mankind Divided
20
30.8
2016 Ashes of the Singularity: Escalation
35
54.8
2016 Doom
51
79.1
2016 Total War: Warhammer
32
49.1
2016 Battlefield 1
38
59.5
2016 Overwatch
31
47.7
2016 Dishonored 2
32
49.3
2015 Grand Theft Auto V
25
38.9
2015 Rocket League
53
82.2
2015 Need For Speed
38
58.7
2015 Project CARS
38
58.7
2015 Rainbow Six Siege
39
59.9
2012 Counter-Strike: Global Offensive
137
211.3
2009 League of Legends
76
117.4
2008 Crysis: Warhead (DX10)
25
38.4
TITAN V with FX-8320 at 1080p and 超级品质 settings
TITAN V with FX-8320 at 1440p and 超级品质 settings
TITAN V with FX-8320 at 4K and 超级品质 settings

与竞争对手比较

TITAN V 规格

TITAN V Board Design

Board NumberPG500 SKU 0
Length10.5 inches 267 mm
Outputs1x HDMI3x DisplayPort
Power Connectors1x 6-pin + 1x 8-pin
Slot WidthDual-slot
TDP250 W

TITAN V Clock Speeds

Boost Clock1455 MHz
GPU Clock1200 MHz
Memory Clock850 MHz 1700 MHz effective

TITAN V Graphics Card

Bus InterfacePCIe 3.0 x16
GenerationGeForce 1000
Launch Price2,999 USD
ProductionActive
Release DateDec 7th, 2017

TITAN V Graphics Features

CUDA7
DirectX12.0 (12_1)
OpenCL2
OpenGL4.6
Shader Model6.1
Vulkan1.1.82

TITAN V Graphics Processor

ArchitectureVolta
Die Size815 mm²
GPU NameGV100
GPU VariantGV100-400-A1
Process Size12 nm
Transistors21,100 million

TITAN V Memory

Bandwidth652.8 GB/s
Memory Bus3072 bit
Memory Size12288 MB
Memory TypeHBM2

TITAN V Render Config

ROPs96
SM Count80
Shading Units5120
TMUs320
Tensor Cores640

TITAN V Theoretical Performance

FP16 (half) performance29,798 GFLOPS (2:1)
FP32 (float) performance14,899 GFLOPS
FP64 (double) performance7,450 GFLOPS (1:2)
Pixel Rate139.7 GPixel/s
Texture Rate465.6 GTexel/s

Critics Reviews


讨论和评论

分享您的评论