R9 Nano con Core i5-10400 parametri di riferimento Alta qualità a impostazioni di qualità

A 1440p, R9 Nano può colpire 50-60 fps su praticamente tutto a Ultra, solo senza anti-aliasing, meno occlusione ambientale e abbassato le ombre. Decidere se investire così tanto denaro in un high-end GPU come R9 Nano richiede un pensiero attento. Con la 4096 RAM corrente MB, R9 Nano il può avere pochissimi colli di bottiglia relativi alla memoria nei giochi più moderni.

 R9 Nano con Core i5-10400 parametri di riferimento Alta qualità a impostazioni di qualità
AMD Radeon R9 Nano
Prezzo € 1,345.5
Anno 2015
Temperatura massima registrata 73C
Massimo rumore del ventilatore 45.8dB
Alimentatore raccomandato 525W
Benchmark CPU Intel Core i5-10400 ($182)
Impatto della CPU su FPS + 2.5 FPS
Impatto della CPU sull'FPS% 0.0%
Impostazioni di qualità benchmark High Quality Settings
Prestazioni medie 1080p 121.5 FPS
Prestazioni 1440p medie 95.5 FPS
(Ultrawide) Prestazioni 1440p medie 83.5 FPS
Prestazioni medie 4K 61.6 FPS
Memoria 4 GB
Costo 1080p per fotogramma € 7.8
Costo 1440 per frame € 10.3
(Ultrawide) Costo 1440 per frame € 12.0
Costo 4K per frame € 17.2
Serie R9 Nano
Variant AMD Radeon R9 Nano
Punteggio complessivo combinazione 66/100 Buona

Il R9 Nano è molto più costoso del R9 390 in quanto costa un € 571.1 enorme. Confronta questo con R9 390, AMD Radeon R9 390X, originariamente al prezzo di € 289.5, € 377.5. Nel frattempo, la NVIDIA carta equivalente più vicina è la GTX 980 che costa € 483.1. Spec per specifica, questo R9 Nano supera i suoi diretti predecessori, il R9 390, vantando 19.1 % di fps in più.

Fortunatamente, le prestazioni di gioco sono state abbastanza impressionanti. Il R9 Nano offre costantemente consistenti aumenti della frequenza dei fotogrammi rispetto a R9 390, AMD Radeon R9 390X e giustifica davvero un aggiornamento. Rispetto al rivale più vicino del NVIDIA, GTX 980, il R9 Nano stato -3.7 % più lento.

Per 1080p Full HD, siamo stati in grado di giocare Hitman 3, Monster Hunter: World, Guardians of the Galaxy, Watch Dogs: Legion, Final Fantasy XV a 60 fps a 63 fps e mantenuto i frame rate attorno a 61 fps. Per 1440p Quad HD, siamo stati in grado di giocare Call of Duty Modern Warfare, World War Z, Overwatch 2, Strange Brigade, Fallout 76 a 63 fps a 70 fps e mantenuto i frame rate attorno a 65 fps.

Per 2160p 4K, siamo stati in grado di giocare Valorant a 102 fps a 102 fps e mantenuto i frame rate attorno a 102 fps.

Assassin's Creed Valhalla (2020)

Alta qualità

Risoluzione 1920x1080

Anno Scheda grafica Prezzo FotoGrammi al secondo
2017 AMD Radeon RX Vega 64 € 439
82.5 FPS
2017 NVIDIA GeForce GTX 1070 Ti € 360
81.9 FPS
2017 AMD Radeon RX Vega 56 € 351
80.2 FPS
2015 NVIDIA GeForce GTX TITAN X € 879
79.9 FPS
2014 AMD Radeon R9 295X2 € 1,319
78.8 FPS
2016 NVIDIA GeForce GTX 1070 € 351
76.8 FPS
2015 NVIDIA GeForce GTX 980 Ti € 571
64.7 FPS
2015 AMD Radeon R9 FURY X € 571
63.7 FPS
2018 AMD Radeon RX 590 € 246
63.2 FPS
2015 AMD Radeon R9 Nano € 571
62.1 FPS
2014 NVIDIA GeForce GTX 980 € 483
59.4 FPS
2015 AMD Radeon R9 FURY € 483
57.8 FPS
2017 AMD Radeon RX 580 € 202
56.1 FPS
2016 NVIDIA GeForce GTX 1060 6GB € 224
55.2 FPS
2014 NVIDIA GeForce GTX TITAN BLACK € 879
54.8 FPS
2012 NVIDIA GeForce GTX 690 € 879
53.7 FPS
2016 AMD Radeon RX 480 € 352
53.2 FPS
2016 NVIDIA GeForce GTX 1060 3GB € 150
53.2 FPS
2013 AMD Radeon HD 7990 € 879
53.0 FPS
2015 AMD Radeon R9 390X € 378
52.9 FPS
2013 NVIDIA GeForce GTX 780 Ti € 615
52.2 FPS
2017 AMD Radeon RX 570 € 149
52.0 FPS
2013 NVIDIA GeForce GTX TITAN € 879
51.5 FPS
2014 NVIDIA GeForce GTX 970 € 290
51.0 FPS
2013 AMD Radeon R9 290X € 483
50.4 FPS
2015 AMD Radeon R9 390 € 290
50.2 FPS
2013 AMD Radeon R9 290 € 351
47.4 FPS
2016 AMD Radeon RX 470 € 158
46.9 FPS
2013 NVIDIA GeForce GTX 780 € 571
43.2 FPS
2012 AMD Radeon HD 7970 GHz Edition € 439
39.4 FPS
2015 AMD Radeon R9 380X € 202
39.2 FPS
2013 AMD Radeon R9 280X € 263
39.0 FPS
2013 NVIDIA GeForce GTX 770 € 351
37.5 FPS
2016 NVIDIA GeForce GTX 1050 Ti € 149
36.6 FPS
2012 NVIDIA GeForce GTX 680 € 439
35.9 FPS
2014 AMD Radeon R9 285 € 219
35.2 FPS
2015 AMD Radeon R9 380 € 175
35.0 FPS
2014 AMD Radeon R9 280 € 246
34.7 FPS
2015 NVIDIA GeForce GTX 960 € 175
34.3 FPS
2012 NVIDIA GeForce GTX 670 € 351
33.4 FPS
2013 NVIDIA GeForce GTX 760 € 219
31.3 FPS
2012 AMD Radeon HD 7950 € 395
30.2 FPS
2012 NVIDIA GeForce GTX 660 Ti € 263
29.7 FPS

Il R9 Nano si trova tra il RX 590 e il GTX 980 , cadendo più lento di RX 590 da 4.5 % e più veloce di GTX 980 da 1.9 %. Ha una forte prestazione relativa rispetto a tutte le schede grafiche qui. Le prestazioni di R9 Nano in questo gioco si aggirano intorno al segno dei 60fps. È un richiamo stretto tra R9 Nano e il suo rivale GTX 980 con un piccolo margine. Inoltre, R9 Nano stato anche più veloce di R9 390 con un buon margine.

Forza Horizon 4 (2018)

Alta qualità

Risoluzione 1920x1080

Anno Scheda grafica Prezzo FotoGrammi al secondo
2017 NVIDIA GeForce GTX 1070 Ti € 360
164.2 FPS
2015 NVIDIA GeForce GTX TITAN X € 879
157.6 FPS
2016 NVIDIA GeForce GTX 1070 € 351
152.2 FPS
2015 NVIDIA GeForce GTX 980 Ti € 571
149.6 FPS
2017 AMD Radeon RX Vega 64 € 439
145.5 FPS
2017 AMD Radeon RX Vega 56 € 351
142.8 FPS
2018 AMD Radeon RX 590 € 246
124.3 FPS
2014 NVIDIA GeForce GTX 980 € 483
120.8 FPS
2016 NVIDIA GeForce GTX 1060 6GB € 224
116.8 FPS
2017 AMD Radeon RX 580 € 202
114.0 FPS
2015 AMD Radeon R9 FURY X € 571
113.7 FPS
2016 NVIDIA GeForce GTX 1060 3GB € 150
111.7 FPS
2014 NVIDIA GeForce GTX 970 € 290
107.1 FPS
2015 AMD Radeon R9 Nano € 571
109.4 FPS
2015 AMD Radeon R9 390X € 378
97.8 FPS
2013 NVIDIA GeForce GTX TITAN € 879
93.4 FPS
2013 AMD Radeon R9 290 € 351
91.9 FPS
2015 AMD Radeon R9 390 € 290
90.4 FPS
2017 AMD Radeon RX 570 € 149
90.4 FPS
2016 AMD Radeon RX 470 € 158
79.9 FPS
2013 NVIDIA GeForce GTX 780 Ti € 615
76.2 FPS
2013 NVIDIA GeForce GTX 780 € 571
73.7 FPS
2015 AMD Radeon R9 380X € 202
72.2 FPS
2015 AMD Radeon R9 380 € 175
69.1 FPS
2015 NVIDIA GeForce GTX 960 € 175
69.1 FPS
2016 NVIDIA GeForce GTX 1050 Ti € 149
67.8 FPS
2013 AMD Radeon R9 290X € 483
67.5 FPS
2012 NVIDIA GeForce GTX 680 € 439
67.5 FPS
2012 NVIDIA GeForce GTX 670 € 351
64.3 FPS
2014 AMD Radeon R9 285 € 219
59.5 FPS
2013 NVIDIA GeForce GTX 760 € 219
58.7 FPS
2013 NVIDIA GeForce GTX 770 € 351
56.9 FPS
2014 AMD Radeon R9 280 € 246
54.7 FPS

Il R9 Nano si trova tra il GTX 970 e il R9 390X , cadendo più lento di GTX 970 da 0.5 % e più veloce di R9 390X da 8.9 %. Ha una prestazione relativa media rispetto a tutte le schede grafiche qui. I suoi risultati sono in realtà indistinguibili da quelli di GTX 970 . Inoltre, R9 Nano stato anche più veloce di R9 390 con un buon margine.

Cyberpunk 2077 (2020)

Alta qualità

Risoluzione 1920x1080

Anno Scheda grafica Prezzo FotoGrammi al secondo
2017 AMD Radeon RX Vega 64 € 439
82.5 FPS
2017 NVIDIA GeForce GTX 1070 Ti € 360
81.9 FPS
2017 AMD Radeon RX Vega 56 € 351
80.2 FPS
2015 NVIDIA GeForce GTX TITAN X € 879
79.9 FPS
2014 AMD Radeon R9 295X2 € 1,319
78.8 FPS
2016 NVIDIA GeForce GTX 1070 € 351
76.8 FPS
2015 NVIDIA GeForce GTX 980 Ti € 571
64.7 FPS
2015 AMD Radeon R9 FURY X € 571
63.7 FPS
2018 AMD Radeon RX 590 € 246
63.2 FPS
2015 AMD Radeon R9 Nano € 571
62.1 FPS
2014 NVIDIA GeForce GTX 980 € 483
59.4 FPS
2015 AMD Radeon R9 FURY € 483
57.8 FPS
2017 AMD Radeon RX 580 € 202
56.1 FPS
2016 NVIDIA GeForce GTX 1060 6GB € 224
55.2 FPS
2014 NVIDIA GeForce GTX TITAN BLACK € 879
54.8 FPS
2012 NVIDIA GeForce GTX 690 € 879
53.7 FPS
2016 AMD Radeon RX 480 € 352
53.2 FPS
2016 NVIDIA GeForce GTX 1060 3GB € 150
53.2 FPS
2013 AMD Radeon HD 7990 € 879
53.0 FPS
2015 AMD Radeon R9 390X € 378
52.9 FPS
2013 NVIDIA GeForce GTX 780 Ti € 615
52.2 FPS
2017 AMD Radeon RX 570 € 149
52.0 FPS
2013 NVIDIA GeForce GTX TITAN € 879
51.5 FPS
2014 NVIDIA GeForce GTX 970 € 290
51.0 FPS
2013 AMD Radeon R9 290X € 483
50.4 FPS
2015 AMD Radeon R9 390 € 290
50.2 FPS
2013 AMD Radeon R9 290 € 351
47.4 FPS
2016 AMD Radeon RX 470 € 158
46.9 FPS
2013 NVIDIA GeForce GTX 780 € 571
43.2 FPS
2012 AMD Radeon HD 7970 GHz Edition € 439
39.4 FPS
2015 AMD Radeon R9 380X € 202
39.2 FPS
2013 AMD Radeon R9 280X € 263
39.0 FPS
2013 NVIDIA GeForce GTX 770 € 351
37.5 FPS
2016 NVIDIA GeForce GTX 1050 Ti € 149
36.6 FPS
2012 NVIDIA GeForce GTX 680 € 439
35.9 FPS
2014 AMD Radeon R9 285 € 219
35.2 FPS
2015 AMD Radeon R9 380 € 175
35.0 FPS
2014 AMD Radeon R9 280 € 246
34.7 FPS
2015 NVIDIA GeForce GTX 960 € 175
34.3 FPS
2012 NVIDIA GeForce GTX 670 € 351
33.4 FPS
2013 NVIDIA GeForce GTX 760 € 219
31.3 FPS
2012 AMD Radeon HD 7950 € 395
30.2 FPS
2012 NVIDIA GeForce GTX 660 Ti € 263
29.7 FPS

Il R9 Nano si trova tra il RX 590 e il GTX 980 , cadendo più lento di RX 590 da 4.5 % e più veloce di GTX 980 da 1.9 %. Ha una forte prestazione relativa rispetto a tutte le schede grafiche qui. Le prestazioni di R9 Nano in questo gioco si aggirano intorno al segno dei 60fps. È un richiamo stretto tra R9 Nano e il suo rivale GTX 980 con un piccolo margine. Inoltre, R9 Nano stato anche più veloce di R9 390 con un buon margine.

Grand Theft Auto V (2015)

Alta qualità

Risoluzione 1920x1080

Anno Scheda grafica Prezzo FotoGrammi al secondo
2017 NVIDIA GeForce GTX 1070 Ti € 360
157.7 FPS
2014 AMD Radeon R9 295X2 € 1,319
153.4 FPS
2016 NVIDIA GeForce GTX 1070 € 351
147.8 FPS
2017 AMD Radeon RX Vega 64 € 439
135.6 FPS
2017 AMD Radeon RX Vega 56 € 351
135.5 FPS
2015 NVIDIA GeForce GTX TITAN X € 879
133.8 FPS
2015 NVIDIA GeForce GTX 980 Ti € 571
130.5 FPS
2015 AMD Radeon R9 FURY X € 571
116.5 FPS
2018 AMD Radeon RX 590 € 246
111.4 FPS
2014 NVIDIA GeForce GTX 980 € 483
110.4 FPS
2015 AMD Radeon R9 Nano € 571
108.1 FPS
2016 NVIDIA GeForce GTX 1060 6GB € 224
104.2 FPS
2017 AMD Radeon RX 580 € 202
102.2 FPS
2016 NVIDIA GeForce GTX 1060 3GB € 150
99.7 FPS
2015 AMD Radeon R9 390X € 378
99.4 FPS
2014 NVIDIA GeForce GTX 970 € 290
96.6 FPS
2015 AMD Radeon R9 390 € 290
95.6 FPS
2013 NVIDIA GeForce GTX TITAN € 879
90.0 FPS
2013 NVIDIA GeForce GTX 780 € 571
88.9 FPS
2013 AMD Radeon R9 290 € 351
88.5 FPS
2017 AMD Radeon RX 570 € 149
87.9 FPS
2013 AMD Radeon R9 290X € 483
84.0 FPS
2016 AMD Radeon RX 470 € 158
84.0 FPS
2013 NVIDIA GeForce GTX 780 Ti € 615
78.5 FPS
2015 AMD Radeon R9 380X € 202
69.2 FPS
2012 NVIDIA GeForce GTX 680 € 439
68.8 FPS
2015 AMD Radeon R9 380 € 175
68.1 FPS
2012 NVIDIA GeForce GTX 670 € 351
66.4 FPS
2015 NVIDIA GeForce GTX 960 € 175
65.8 FPS
2014 AMD Radeon R9 285 € 219
65.4 FPS
2014 AMD Radeon R9 280 € 246
65.3 FPS
2016 NVIDIA GeForce GTX 1050 Ti € 149
60.7 FPS
2013 NVIDIA GeForce GTX 770 € 351
58.7 FPS
2013 NVIDIA GeForce GTX 760 € 219
58.1 FPS

Il R9 Nano si trova tra il GTX 980 e il GTX 1060 6GB , cadendo più lento di GTX 980 da 4.9 % e più veloce di GTX 1060 6GB da 1 %. Ha una prestazione relativa media rispetto a tutte le schede grafiche qui. È un richiamo stretto tra R9 Nano e il suo rivale GTX 980 con un piccolo margine. Inoltre, R9 Nano stato anche più veloce di R9 390 con un buon margine.

Call of Duty Modern Warfare (2019)

Alta qualità

Risoluzione 1920x1080

Anno Scheda grafica Prezzo FotoGrammi al secondo
2017 AMD Radeon RX Vega 64 € 439
189.3 FPS
2017 NVIDIA GeForce GTX 1070 Ti € 360
188.1 FPS
2017 AMD Radeon RX Vega 56 € 351
184.2 FPS
2015 NVIDIA GeForce GTX TITAN X € 879
183.6 FPS
2014 AMD Radeon R9 295X2 € 1,319
181.0 FPS
2016 NVIDIA GeForce GTX 1070 € 351
176.8 FPS
2015 NVIDIA GeForce GTX 980 Ti € 571
149.3 FPS
2015 AMD Radeon R9 FURY X € 571
147.1 FPS
2018 AMD Radeon RX 590 € 246
146.2 FPS
2015 AMD Radeon R9 Nano € 571
143.9 FPS
2014 NVIDIA GeForce GTX 980 € 483
137.4 FPS
2015 AMD Radeon R9 FURY € 483
133.8 FPS
2017 AMD Radeon RX 580 € 202
130.1 FPS
2016 NVIDIA GeForce GTX 1060 6GB € 224
127.7 FPS
2014 NVIDIA GeForce GTX TITAN BLACK € 879
127.3 FPS
2012 NVIDIA GeForce GTX 690 € 879
124.5 FPS
2016 AMD Radeon RX 480 € 352
123.6 FPS
2016 NVIDIA GeForce GTX 1060 3GB € 150
123.6 FPS
2013 AMD Radeon HD 7990 € 879
123.1 FPS
2015 AMD Radeon R9 390X € 378
122.7 FPS
2013 NVIDIA GeForce GTX 780 Ti € 615
121.2 FPS
2017 AMD Radeon RX 570 € 149
120.8 FPS
2013 NVIDIA GeForce GTX TITAN € 879
119.8 FPS
2014 NVIDIA GeForce GTX 970 € 290
118.5 FPS
2013 AMD Radeon R9 290X € 483
117.2 FPS
2015 AMD Radeon R9 390 € 290
116.7 FPS
2013 AMD Radeon R9 290 € 351
110.4 FPS
2016 AMD Radeon RX 470 € 158
109.1 FPS
2013 NVIDIA GeForce GTX 780 € 571
100.6 FPS
2012 AMD Radeon HD 7970 GHz Edition € 439
92.1 FPS
2015 AMD Radeon R9 380X € 202
91.8 FPS
2013 AMD Radeon R9 280X € 263
91.0 FPS
2013 NVIDIA GeForce GTX 770 € 351
87.4 FPS
2016 NVIDIA GeForce GTX 1050 Ti € 149
85.5 FPS
2012 NVIDIA GeForce GTX 680 € 439
83.8 FPS
2014 AMD Radeon R9 285 € 219
82.3 FPS
2015 AMD Radeon R9 380 € 175
82.0 FPS
2014 AMD Radeon R9 280 € 246
81.1 FPS
2015 NVIDIA GeForce GTX 960 € 175
80.2 FPS
2012 NVIDIA GeForce GTX 670 € 351
78.5 FPS
2013 NVIDIA GeForce GTX 760 € 219
73.6 FPS
2012 AMD Radeon HD 7950 € 395
70.8 FPS
2012 NVIDIA GeForce GTX 660 Ti € 263
69.8 FPS

Il R9 Nano si trova tra il RX 590 e il GTX 980 , cadendo più lento di RX 590 da 4.3 % e più veloce di GTX 980 da 2 %. Ha una forte prestazione relativa rispetto a tutte le schede grafiche qui. Coloro che hanno un monitor ad alta frequenza di aggiornamento apprezzeranno ciò che R9 Nano ha da offrire in media 143.90832331748 fps. È un richiamo stretto tra R9 Nano e il suo rivale GTX 980 con un piccolo margine. Inoltre, R9 Nano stato anche più veloce di R9 390 con un buon margine.

Prestazioni del gioco Alta qualità alle impostazioni

Modificare le impostazioni di qualità

Risoluzione 1920x1080

1% Low [Min FPS] Average FPS
Anno Gioco FotoGrammi al secondo
2023 Resident Evil 4
91
101.2
2023 A Plague Tale: Requiem
65
72.8
2023 Hogwarts Legacy
58
64.5
2023 The Last of Us Part I
46
51.4
2023 Forspoken
52
58.4
2023 The Callisto Protocol
42
46.7
2023 Dead Space
65
72.8
2023 Baldur's Gate 3
75
84.4
2023 Armored Core VI
75
84.4
2023 Immortals of Aveum
38
42.3
2023 Ratchet and Clank Rift Apart
69
77.0
2023 Remnant II
42
46.7
2023 Star Wars Jedi: Survivor
54
60.2
2023 Atomic Heart
54
60.2
2023 Starfield
29
32.9
2022 Elden Ring
69
77.6
2022 God of War
66
74.2
2022 Overwatch 2
113
126.1
2022 F1 22
76
85.3
2022 Dying Light 2
73
81.3
2022 Total War: Warhammer III
73
81.3
2022 Spider-Man Remastered
111
124.3
2022 Call of Duty: Modern Warfare II
84
93.4
2021 Forza Horizon 5
67
75.0
2021 Halo Infinite
53
59.4
2021 Battlefield 2042
90
100.5
2021 Hitman 3
94
105.1
2021 Far Cry 6
89
99.0
2021 Guardians of the Galaxy
96
106.7
2020 Watch Dogs: Legion
96
107.6
2020 Assassin's Creed Valhalla
55
62.1
2020 Microsoft Flight Simulator
38
43.0
2020 Valorant
196
218.2
2020 Call of Duty: Black Ops Cold War
89
99.1
2020 Death Stranding
100
112.1
2020 Marvel's Avengers
69
77.6
2020 Godfall
98
109.6
2020 Cyberpunk 2077
55
62.1
2019 Apex Legends
110
122.6
2019 Anthem
75
84.3
2019 Far Cry New Dawn
105
116.8
2019 Resident Evil 2
130
145.1
2019 Metro Exodus
65
72.7
2019 World War Z
129
143.9
2019 Gears of War 5
90
100.5
2019 F1 2019
109
121.9
2019 GreedFall
100
111.4
2019 Borderlands 3
74
82.3
2019 Call of Duty Modern Warfare
129
143.9
2019 Red Dead Redemption 2
57
63.7
2019 Need For Speed: Heat
84
93.8
2018 Call of Duty: Black Ops 4
119
132.6
2018 Assassin's Creed Odyssey
62
69.4
2018 Final Fantasy XV
98
109.4
2018 Shadow of the Tomb Raider
80
89.8
2018 Forza Horizon 4
98
109.4
2018 Fallout 76
105
116.8
2018 Hitman 2
84
94.4
2018 Just Cause 4
89
99.7
2018 Monster Hunter: World
95
106.3
2018 Strange Brigade
135
150.5
2018 Battlefield V
101
112.4
2017 Assassin's Creed Origins
84
94.4
2017 Destiny 2
147
164.4
2017 PlayerUnknown's Battlegrounds
84
94.4
2017 Fortnite Battle Royale
99
110.4
2017 Need For Speed: Payback
118
131.6
2017 For Honor
150
167.7
2017 Project CARS 2
112
125.2
2017 Forza Motorsport 7
132
147.4
2016 Ashes of the Singularity
87
97.7
2016 Hitman
125
139.4
2016 Rise of the Tomb Raider
109
121.5
2016 The Division
100
111.7
2016 Overwatch
143
159.9
2016 Dishonored 2
86
95.8
2015 DiRT Rally
162
180.8
2015 Grand Theft Auto V
97
108.1
2015 The Witcher 3
93
103.8
2015 Total War: Attila
88
98.8
2015 Rocket League
364
405.0
2015 Need For Speed
126
140.2
2015 Project CARS
121
135.3
2015 Rainbow Six Siege
201
224.3
2014 Civilization: Beyond Earth
161
179.5
2014 Dragon Age: Inquisition
120
133.4
2014 Far Cry 4
114
126.9
2014 GRID Autosport
120
134.1
2014 Shadow of Mordor
149
165.9
2014 The Talos Principle
162
180.4
2013 Crysis 3
107
119.9
2013 Battlefield 4
131
146.3
2012 Counter-Strike: Global Offensive
268
298.1
2009 League of Legends
445
495.4

Risoluzione 2560x1440

1% Low [Min FPS] Average FPS
Anno Gioco FotoGrammi al secondo
2023 Resident Evil 4
60
76.1
2023 A Plague Tale: Requiem
44
55.2
2023 Hogwarts Legacy
40
50.7
2023 The Last of Us Part I
31
39.9
2023 Forspoken
31
39.9
2023 The Callisto Protocol
27
34.3
2023 Dead Space
40
50.7
2023 Baldur's Gate 3
55
69.5
2023 Armored Core VI
55
69.5
2023 Immortals of Aveum
24
30.4
2023 Ratchet and Clank Rift Apart
44
55.2
2023 Remnant II
25
32.4
2023 Star Wars Jedi: Survivor
36
46.2
2023 Atomic Heart
35
44.5
2023 Starfield
23
29.5
2022 Elden Ring
49
62.4
2022 God of War
51
64.2
2022 Overwatch 2
87
109.3
2022 F1 22
44
55.2
2022 Dying Light 2
44
55.2
2022 Total War: Warhammer III
47
59.4
2022 Spider-Man Remastered
73
92.1
2022 Call of Duty: Modern Warfare II
50
63.5
2021 Forza Horizon 5
51
65.0
2021 Halo Infinite
42
53.4
2021 Battlefield 2042
55
69.7
2021 Hitman 3
62
77.7
2021 Far Cry 6
60
76.1
2021 Guardians of the Galaxy
62
78.5
2020 Watch Dogs: Legion
58
73.6
2020 Assassin's Creed Valhalla
43
54.2
2020 Microsoft Flight Simulator
30
37.8
2020 Valorant
145
182.2
2020 Call of Duty: Black Ops Cold War
63
79.3
2020 Death Stranding
71
89.1
2020 Marvel's Avengers
45
57.1
2020 Godfall
61
76.7
2020 Cyberpunk 2077
46
57.9
2019 Apex Legends
75
94.0
2019 Anthem
54
68.1
2019 Far Cry New Dawn
74
92.8
2019 Resident Evil 2
81
102.3
2019 Metro Exodus
46
57.8
2019 World War Z
86
108.7
2019 Gears of War 5
60
75.3
2019 F1 2019
71
89.5
2019 GreedFall
66
83.2
2019 Borderlands 3
48
60.0
2019 Call of Duty Modern Warfare
85
107.4
2019 Red Dead Redemption 2
42
52.7
2019 Need For Speed: Heat
60
75.3
2018 Call of Duty: Black Ops 4
67
84.0
2018 Assassin's Creed Odyssey
44
55.5
2018 Final Fantasy XV
64
81.0
2018 Shadow of the Tomb Raider
52
65.3
2018 Forza Horizon 4
75
94.7
2018 Fallout 76
94
118.1
2018 Hitman 2
52
65.3
2018 Just Cause 4
60
76.1
2018 Monster Hunter: World
61
77.3
2018 Strange Brigade
87
109.3
2018 Battlefield V
72
90.1
2017 Assassin's Creed Origins
61
76.4
2017 Destiny 2
114
143.4
2017 PlayerUnknown's Battlegrounds
58
73.1
2017 Fortnite Battle Royale
60
75.3
2017 Need For Speed: Payback
78
98.4
2017 For Honor
83
105.0
2017 Project CARS 2
73
91.9
2017 Forza Motorsport 7
106
133.5
2016 Ashes of the Singularity
69
87.1
2016 Hitman
87
110.0
2016 Rise of the Tomb Raider
71
89.7
2016 The Division
69
86.4
2016 Overwatch
92
115.1
2016 Dishonored 2
66
82.6
2015 DiRT Rally
108
135.5
2015 Grand Theft Auto V
64
80.3
2015 The Witcher 3
65
82.3
2015 Total War: Attila
58
72.8
2015 Rocket League
159
199.6
2015 Need For Speed
88
111.1
2015 Project CARS
85
106.3
2015 Rainbow Six Siege
123
153.8
2014 Civilization: Beyond Earth
117
146.3
2014 Dragon Age: Inquisition
79
98.8
2014 Far Cry 4
93
116.4
2014 GRID Autosport
107
134.1
2014 Shadow of Mordor
100
125.2
2014 The Talos Principle
110
138.6
2013 Crysis 3
66
83.7
2013 Battlefield 4
83
104.5
2012 Counter-Strike: Global Offensive
202
253.4
2009 League of Legends
243
304.3

Risoluzione 3440x1440

1% Low [Min FPS] Average FPS
Anno Gioco FotoGrammi al secondo
2019 Apex Legends
62
82.0
2019 Anthem
43
57.6
2019 Far Cry New Dawn
59
78.1
2019 Resident Evil 2
64
84.3
2019 Metro Exodus
38
51.2
2019 World War Z
71
93.8
2019 Gears of War 5
50
66.9
2019 F1 2019
60
79.7
2019 GreedFall
49
65.3
2019 Borderlands 3
38
50.1
2019 Call of Duty Modern Warfare
71
93.8
2019 Red Dead Redemption 2
35
46.9
2019 Need For Speed: Heat
50
66.9
2018 Call of Duty: Black Ops 4
58
77.4
2018 Assassin's Creed Odyssey
38
50.7
2018 Final Fantasy XV
53
69.8
2018 Shadow of the Tomb Raider
41
54.3
2018 Forza Horizon 4
64
84.9
2018 Fallout 76
76
100.9
2018 Hitman 2
42
56.0
2018 Just Cause 4
48
63.5
2018 Monster Hunter: World
47
63.1
2018 Strange Brigade
70
92.7
2018 Battlefield V
55
73.3
2017 Assassin's Creed Origins
51
68.1
2017 Destiny 2
90
118.8
2017 PlayerUnknown's Battlegrounds
47
63.1
2017 Fortnite Battle Royale
48
63.7
2017 Need For Speed: Payback
68
90.1
2017 For Honor
65
86.7
2017 Project CARS 2
68
90.3
2017 Forza Motorsport 7
99
131.5
2016 Ashes of the Singularity
63
83.2
2016 Hitman
72
95.2
2016 Rise of the Tomb Raider
57
76.1
2016 The Division
56
74.4
2016 Overwatch
73
96.2
2016 Dishonored 2
60
79.6
2015 DiRT Rally
88
116.5
2015 Grand Theft Auto V
50
66.2
2015 The Witcher 3
54
72.3
2015 Total War: Attila
55
73.6
2015 Rocket League
123
162.6
2015 Need For Speed
76
100.7
2015 Project CARS
74
98.0
2015 Rainbow Six Siege
95
125.1
2014 Civilization: Beyond Earth
99
130.8
2014 Dragon Age: Inquisition
63
83.8
2014 Far Cry 4
75
98.8
2014 GRID Autosport
92
121.5
2014 Shadow of Mordor
81
107.3
2014 The Talos Principle
90
119.6
2013 Crysis 3
52
69.1
2013 Battlefield 4
74
98.1
2012 Counter-Strike: Global Offensive
194
256.5
2009 League of Legends
182
239.6

Risoluzione 3840x2160

1% Low [Min FPS] Average FPS
Anno Gioco FotoGrammi al secondo
2023 Resident Evil 4
41
59.2
2023 A Plague Tale: Requiem
25
37.0
2023 Hogwarts Legacy
25
37.0
2023 The Last of Us Part I
15
22.6
2023 Forspoken
14
20.6
2023 The Callisto Protocol
13
18.6
2023 Dead Space
15
22.6
2023 Baldur's Gate 3
29
41.6
2023 Armored Core VI
29
41.6
2023 Immortals of Aveum
10
15.5
2023 Ratchet and Clank Rift Apart
22
32.4
2023 Remnant II
12
17.5
2023 Star Wars Jedi: Survivor
17
24.5
2023 Atomic Heart
20
29.5
2023 Starfield
14
20.6
2022 Elden Ring
26
38.2
2022 God of War
35
51.4
2022 Overwatch 2
60
85.8
2022 F1 22
29
41.6
2022 Dying Light 2
29
41.6
2022 Total War: Warhammer III
32
46.0
2022 Spider-Man Remastered
47
67.7
2022 Call of Duty: Modern Warfare II
29
41.6
2021 Forza Horizon 5
36
51.9
2021 Halo Infinite
26
38.3
2021 Battlefield 2042
33
47.6
2021 Hitman 3
35
50.6
2021 Far Cry 6
31
44.4
2021 Guardians of the Galaxy
32
46.0
2020 Watch Dogs: Legion
35
50.6
2020 Assassin's Creed Valhalla
26
38.3
2020 Microsoft Flight Simulator
21
30.7
2020 Valorant
113
161.7
2020 Call of Duty: Black Ops Cold War
32
46.0
2020 Death Stranding
40
57.8
2020 Marvel's Avengers
22
32.4
2020 Godfall
28
40.3
2020 Cyberpunk 2077
28
40.1
2019 Apex Legends
42
60.2
2019 Anthem
28
40.1
2019 Far Cry New Dawn
37
53.7
2019 Resident Evil 2
38
55.5
2019 Metro Exodus
26
38.3
2019 World War Z
47
67.5
2019 Gears of War 5
35
50.4
2019 F1 2019
42
60.5
2019 GreedFall
26
38.3
2019 Borderlands 3
23
33.8
2019 Call of Duty Modern Warfare
48
68.9
2019 Red Dead Redemption 2
24
35.4
2019 Need For Speed: Heat
35
50.4
2018 Call of Duty: Black Ops 4
43
61.8
2018 Assassin's Creed Odyssey
28
40.1
2018 Final Fantasy XV
35
50.2
2018 Shadow of the Tomb Raider
25
36.4
2018 Forza Horizon 4
45
65.0
2018 Fallout 76
49
71.4
2018 Hitman 2
28
40.1
2018 Just Cause 4
30
43.2
2018 Monster Hunter: World
28
40.8
2018 Strange Brigade
45
64.7
2018 Battlefield V
32
46.9
2017 Assassin's Creed Origins
36
51.9
2017 Destiny 2
55
79.3
2017 PlayerUnknown's Battlegrounds
31
45.2
2017 Fortnite Battle Royale
30
44.2
2017 Need For Speed: Payback
50
71.6
2017 For Honor
40
57.6
2017 Project CARS 2
54
78.5
2017 Forza Motorsport 7
80
114.8
2016 Ashes of the Singularity
48
69.8
2016 Hitman
48
68.6
2016 Rise of the Tomb Raider
37
52.9
2016 The Division
37
53.2
2016 Overwatch
45
65.0
2016 Dishonored 2
47
67.5
2015 DiRT Rally
58
83.2
2015 Grand Theft Auto V
30
43.7
2015 The Witcher 3
37
53.7
2015 Total War: Attila
46
65.8
2015 Rocket League
73
104.7
2015 Need For Speed
54
78.5
2015 Project CARS
54
78.5
2015 Rainbow Six Siege
55
79.9
2014 Civilization: Beyond Earth
69
99.9
2014 Dragon Age: Inquisition
40
58.2
2014 Far Cry 4
48
69.2
2014 GRID Autosport
66
94.7
2014 Shadow of Mordor
53
76.1
2014 The Talos Principle
60
85.9
2013 Crysis 3
31
45.7
2013 Battlefield 4
56
80.6
2012 Counter-Strike: Global Offensive
162
231.6
2009 League of Legends
99
141.6
R9 Nano with Core i5-10400 at 1080p and Alta qualità settings
R9 Nano with Core i5-10400 at 1440p and Alta qualità settings
R9 Nano with Core i5-10400 at 4K and Alta qualità settings

Confronta contro i concorrenti

R9 Nano Specifiche

R9 Nano Board Design

Board NumberC882
Length6 inches 152 mm
Outputs1x HDMI3x DisplayPort
Power Connectors1x 8-pin
Slot WidthDual-slot
TDP175 W

R9 Nano Clock Speeds

GPU Clock1000 MHz
Memory Clock500 MHz 1000 MHz effective

R9 Nano Graphics Card

Bus InterfacePCIe 3.0 x16
GenerationPirate Islands (R9 300)
Launch Price649 USD
ProductionActive
Release DateAug 27th, 2015

R9 Nano Graphics Features

DirectX12.0 (12_0)
OpenCL2
OpenGL4.5
Shader Model6
Vulkan1.1.82

R9 Nano Graphics Processor

ArchitectureGCN 3.0
Die Size596 mm²
GPU NameFiji
GPU VariantFiji XT CA (215-0862120)
Process Size28 nm
Transistors8,900 million

R9 Nano Memory

Bandwidth512.0 GB/s
Memory Bus4096 bit
Memory Size4096 MB
Memory TypeHBM

R9 Nano Render Config

Compute Units64
ROPs64
Shading Units4096
TMUs256

R9 Nano Theoretical Performance

FP16 (half) performance8,192 GFLOPS (1:1)
FP32 (float) performance8,192 GFLOPS
FP64 (double) performance512.0 GFLOPS (1:16)
Pixel Rate64.00 GPixel/s
Texture Rate256.0 GTexel/s

Critics Reviews

The AMD Radeon R9 Nano shows that you don’t always have to be the fastest to win the race. Some races are more of a marathon, and it’s more important to pace yourself well. MORE: Best Graphics ...
The Radeon R9 Nano is the fruition of AMD's gamble of integrating stacked high-bandwidth memory (HBM) and a 4,096 SP pixel-grinder into a compact multi-chip module that eliminates the need for external memory chips, freeing up large swathes of PCB area.
The new Radeon R9 Nano is the little brother to the existing AMD Radeon R9 Fury cards – in water-cooled 'X' and air-cooled standard models – and deserves that distinction in more ways than one.
AMD seems to have hit all the cues it set out to with the Radeon R9 Nano. This card is ridiculously tiny in light of other high-end GPUs, its power consumption characteristics are significantly ...
AMD's R9 Nano is a graphics card that serves its (very) niche high-end small form factor market well but its premium pricing makes it unaffordable to many small form factor system builders, and ...
AMD's R9 Nano is a hell of a little graphics card, delivering near-R9 Fury X performance in a compact mini-ITX form-factor. It's also expensive—very expensive—at $650, matching the price of ...
The AMD Radeon R9 Fury Nano is one of the most exciting graphics cards I’ve seen for years and, at only 6in long, it’s also one of the smallest. ... Verdict. AMD’s latest card is one of its ...
While AMD is pegging the Radeon R9 Nano as a luxury card, a component that isn't meant to be about value for money, rather it's all about getting the maximum performance for a small form factor PC ...
With the Radeon R9 Nano at the heart of our test rig, it consumed over 90 fewer watts than the Fury X--AMD's specified power ratings are in-line with our testing.
AMD Radeon R9 Nano Overclocking Results Extra performance with the R9 Nano comes in two distinct areas, overclocking and power management. Interestingly, AMD lets users unlock the power management ...
The R9 Nano is stunningly powerful given its Mini-ITX-friendly form factor, and a true leap ahead for AMD. Just know that this is a specialized component meant for very tight, compact PCs, and ...
As it turns out, AMD's Radeon R9 Nano is a great piece of hardware; there's really nothing like it out there. That’s probably why AMD is setting its price at an eye-popping $649. A lack of ...
The Radeon R9 Nano is AMD's solution for all small-form-factor system builders that want to create a 4K-capable gaming PC in a tiny volume. Thanks to a new approach to power management, the card stays below 200 W at all times, while still delivering excellent framerates.
AMD Radeon R9 Nano - the Digital Foundry verdict The R9 Nano packs an unprecedented amount of rendering power into an absolutely tiny product, and possesses superb build quality.
AMD deserves some serious props for even creating the Radeon R9 Nano in the first place. This pint-sized powerhouse is the latest in a long line of AMD technical innovations that skate to where ...
We’ll have a full suite of Radeon R9 Nano benchmarks recorded in our ultra-high-end graphics test-bed, along with comparison numbers from an array of other high-end GPUs, a little later.
AMD’s itty-bitty Radeon R9 Nano isn’t due to launch until September 10, but a review unit landed on my doorstep today. Sadly, I can’t talk about its performance until then, but an AMD ...
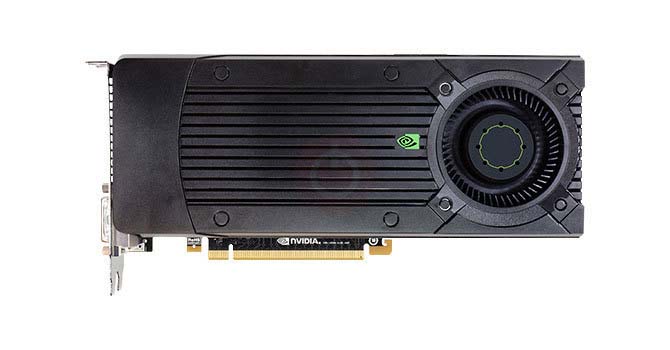
The Radeon R9 Nano is a high-end graphics card by AMD, launched in August 2015. Built on the 28 nm process, and based on the Fiji graphics processor, in its Fiji XT CA variant, the card supports DirectX 12.0.
The AMD Radeon R9 Nano finished just behind the Radeon R9 Fury here, but well ahead of the R9 390 or similarly-sized GeForce GTX 970 mini (the Asus GeForce GTX 970 Direct-CU mini to be exact).
As it turns out, AMD's Radeon R9 Nano is a great piece of hardware; there's really nothing like it out there. That’s probably why AMD is setting its price at an eye-popping $649.
Meanwhile at the other end of the spectrum is the Radeon R9 Nano, which sees AMD push the limits on miniaturization and pack Fiji into a card just 6 inches long.

Discussione e commenti

Condividi i tuoi commenti
S
Stan 6 years ago
649 $ NOT 1529$ lmao
1 0