R9 FURY X गुणवत्ता Core i5-12600K सेटिंग्स पर उच्च गुणवत्ता बेंचमार्क के साथ

1440p पर, R9 FURY X अल्ट्रा में बहुत ज्यादा सब कुछ पर 50-60 एफपीएस मारा, बस antialiasing, कम परिवेश रोड़ा और नीचे छाया के बिना कर सकते हैं । यह ध्यान देने योग्य बात है R9 FURY X कि एक बहुत शक्ति भूख कार्ड है और एक सभ्य बिजली की आपूर्ति इकाई की आवश्यकता है लायक है । के साथ अधिकतम लोड तापमान का संबंध है, R9 FURY X ठंडा है यह शांत और नियंत्रण में रखने में उत्कृष्ट है । तय है कि एक उच्च अंत में इतना पैसा निवेश की तरह R9 FURY X GPU सावधान सोचा की आवश्यकता है । वर्तमान 4096 एमबी रैम के साथ R9 FURY X , अधिक आधुनिक खेल में बहुत कुछ स्मृति से संबंधित अड़चनों हो सकता है ।

 R9 FURY X गुणवत्ता Core i5-12600K सेटिंग्स पर उच्च गुणवत्ता बेंचमार्क के साथ
AMD Radeon R9 FURY X
मूल्य ₹ 46,169.9
साल 2015
अधिकतम दर्ज तापमान 65C
मैक्स फैन शोर 47.4dB
बिजली की आपूर्ति की सिफारिश की 625W
बेंचमार्क सीपीयू Intel Core i5-12600K ($289.99)
एफपीएस पर CPU प्रभाव + 5.8 FPS
एफपीएस% पर CPU प्रभाव + 10.0%
बेंचमार्क गुणवत्ता सेटिंग्स High Quality Settings
औसत 1080p प्रदर्शन 135.9 FPS
औसत 1440p प्रदर्शन 108.1 FPS
(Ultrawide) औसत 1440p प्रदर्शन 94.4 FPS
औसत 4k प्रदर्शन 69.8 FPS
स्मृति 4 GB
1080p लागत प्रति फ्रेम ₹ 550.6
1440 पी प्रति फ्रेम लागत ₹ 719.9
(Ultrawide) 1440 पी प्रति फ्रेम लागत ₹ 843.7
प्रति फ्रेम 4K लागत ₹ 1,199.4
श्रृंखला R9 FURY X
Variant AMD Radeon R9 FURY X
कुल मिलाकर संयोजन स्कोर 75/100 बहुत अच्छा

R9 FURY X R9 390 तुलना में बहुत अधिक महंगा है क्योंकि इसमें लागत ₹ 46169.9 । इसकी तुलना R9 390, AMD Radeon R9 390X, जो मूल रूप से ₹ 23405.1, ₹ 30519.1 की कीमत पर आया था। इस बीच, NVIDIA निकटतम समकक्ष कार्ड GTX 980 जिसकी लागत ₹ 39055.9 । विशेष रूप से कल्पना के लिए, यह R9 FURY X अपने प्रत्यक्ष पूर्ववर्ती, R9 390, 30.9 % अधिक एफपीएस को 30.9 करके।

अपने NVIDIA GTX 980 निकटतम प्रतिद्वंद्वी, GTX 980, R9 FURY X 5.8 % तेजी से था। सौभाग्य से, गेमिंग प्रदर्शन काफी प्रभावशाली था। R9 FURY X लगातार R9 390, AMD Radeon R9 390X से अधिक महान फ्रेम दर बढ़ाता है और यह वास्तव में एक उन्नयन को सही ठहराता है।

1080p Full HD, हम Battlefield 2042, Gears of War 5, Far Cry 6, Resident Evil 4, Monster Hunter: World को 60 एफपीएस से 65 एफपीएस और खेलने में सक्षम थे, फ्रेम रेट्स को 62 एफपीएस के आसपास 62 । 1440p Quad HD, हम Apex Legends, Resident Evil 2, Call of Duty Modern Warfare, Overwatch 2, Strange Brigade को 60 एफपीएस से 68 एफपीएस और खेलने में सक्षम थे, फ्रेम रेट्स को 65 एफपीएस के आसपास 65 ।

2160p 4K, हम Valorant को 108 एफपीएस से 108 एफपीएस और खेलने में सक्षम थे, फ्रेम रेट्स को 108 एफपीएस के आसपास 108 ।

Assassin's Creed Valhalla (2020)

उच्च गुणवत्ता

संकल्प 1920x1080

साल ग्राफ़िक्स कार्ड मूल्य फ़्रेम प्रति सेकंड
2016 NVIDIA GeForce GTX 1080 ₹ 35,499
85.8 FPS
2017 AMD Radeon RX Vega 64 ₹ 35,499
82.5 FPS
2017 NVIDIA GeForce GTX 1070 Ti ₹ 29,096
81.9 FPS
2017 AMD Radeon RX Vega 56 ₹ 28,385
80.2 FPS
2015 NVIDIA GeForce GTX TITAN X ₹ 71,069
79.9 FPS
2016 NVIDIA GeForce GTX 1070 ₹ 28,385
76.8 FPS
2015 NVIDIA GeForce GTX 980 Ti ₹ 46,170
64.7 FPS
2015 AMD Radeon R9 FURY X ₹ 46,170
67.3 FPS
2018 AMD Radeon RX 590 ₹ 19,848
63.2 FPS
2015 AMD Radeon R9 Nano ₹ 46,170
60.5 FPS
2014 NVIDIA GeForce GTX 980 ₹ 39,056
59.4 FPS
2015 AMD Radeon R9 FURY ₹ 39,056
57.8 FPS
2017 AMD Radeon RX 580 ₹ 16,291
56.1 FPS
2016 NVIDIA GeForce GTX 1060 6GB ₹ 18,070
55.2 FPS
2014 NVIDIA GeForce GTX TITAN BLACK ₹ 71,069
54.8 FPS
2012 NVIDIA GeForce GTX 690 ₹ 71,069
53.7 FPS
2016 AMD Radeon RX 480 ₹ 28,456
53.2 FPS
2016 NVIDIA GeForce GTX 1060 3GB ₹ 12,094
53.2 FPS
2013 AMD Radeon HD 7990 ₹ 71,069
53.0 FPS
2015 AMD Radeon R9 390X ₹ 30,519
52.9 FPS
2013 NVIDIA GeForce GTX 780 Ti ₹ 49,727
52.2 FPS
2017 AMD Radeon RX 570 ₹ 12,023
52.0 FPS
2013 NVIDIA GeForce GTX TITAN ₹ 71,069
51.5 FPS
2014 NVIDIA GeForce GTX 970 ₹ 23,405
51.0 FPS
2013 AMD Radeon R9 290X ₹ 39,056
50.4 FPS
2015 AMD Radeon R9 390 ₹ 23,405
50.2 FPS
2013 AMD Radeon R9 290 ₹ 28,385
47.4 FPS
2016 AMD Radeon RX 470 ₹ 12,734
46.9 FPS
2013 NVIDIA GeForce GTX 780 ₹ 46,170
43.2 FPS
2012 AMD Radeon HD 7970 GHz Edition ₹ 35,499
39.4 FPS
2015 AMD Radeon R9 380X ₹ 16,291
39.2 FPS
2013 AMD Radeon R9 280X ₹ 21,271
39.0 FPS
2013 NVIDIA GeForce GTX 770 ₹ 28,385
37.5 FPS
2016 NVIDIA GeForce GTX 1050 Ti ₹ 12,023
36.6 FPS
2012 NVIDIA GeForce GTX 680 ₹ 35,499
35.9 FPS
2014 AMD Radeon R9 285 ₹ 17,714
35.2 FPS
2015 AMD Radeon R9 380 ₹ 14,157
35.0 FPS
2012 NVIDIA GeForce GTX 670 ₹ 28,385
33.4 FPS
2012 AMD Radeon HD 7950 ₹ 31,942
30.2 FPS
2012 NVIDIA GeForce GTX 660 Ti ₹ 21,271
29.7 FPS

R9 FURY X के बीच बैठता है GTX 980 Ti और RX 590 , की तुलना में धीमी गिरने GTX 980 Ti द्वारा 1.5 % और की तुलना में तेजी RX 590 द्वारा 0.8 %। यहां प्रत्येक ग्राफिक्स कार्ड के खिलाफ इसका मजबूत सापेक्ष प्रदर्शन है। इसके परिणाम वास्तव में GTX 980 Ti से अप्रभेद्य हैं। R9 FURY X ने औसतन 67.338290890206 एफपीएस इन , GTX 980 को अच्छे अंतर से टॉप किया। इसके अलावा, R9 FURY X अच्छे अंतर से R9 390 से भी तेज था।

Forza Horizon 4 (2018)

उच्च गुणवत्ता

संकल्प 1920x1080

साल ग्राफ़िक्स कार्ड मूल्य फ़्रेम प्रति सेकंड
2016 NVIDIA GeForce GTX 1080 ₹ 35,499
179.8 FPS
2017 NVIDIA GeForce GTX 1070 Ti ₹ 29,096
164.2 FPS
2015 NVIDIA GeForce GTX TITAN X ₹ 71,069
157.6 FPS
2016 NVIDIA GeForce GTX 1070 ₹ 28,385
152.2 FPS
2015 NVIDIA GeForce GTX 980 Ti ₹ 46,170
149.6 FPS
2017 AMD Radeon RX Vega 64 ₹ 35,499
145.5 FPS
2017 AMD Radeon RX Vega 56 ₹ 28,385
142.8 FPS
2018 AMD Radeon RX 590 ₹ 19,848
124.3 FPS
2014 NVIDIA GeForce GTX 980 ₹ 39,056
120.8 FPS
2016 NVIDIA GeForce GTX 1060 6GB ₹ 18,070
116.8 FPS
2017 AMD Radeon RX 580 ₹ 16,291
114.0 FPS
2015 AMD Radeon R9 FURY X ₹ 46,170
120.1 FPS
2016 NVIDIA GeForce GTX 1060 3GB ₹ 12,094
111.7 FPS
2014 NVIDIA GeForce GTX 970 ₹ 23,405
107.1 FPS
2015 AMD Radeon R9 Nano ₹ 46,170
106.5 FPS
2015 AMD Radeon R9 390X ₹ 30,519
97.8 FPS
2013 NVIDIA GeForce GTX TITAN ₹ 71,069
93.4 FPS
2013 AMD Radeon R9 290 ₹ 28,385
91.9 FPS
2015 AMD Radeon R9 390 ₹ 23,405
90.4 FPS
2017 AMD Radeon RX 570 ₹ 12,023
90.4 FPS
2016 AMD Radeon RX 470 ₹ 12,734
79.9 FPS
2013 NVIDIA GeForce GTX 780 Ti ₹ 49,727
76.2 FPS
2013 NVIDIA GeForce GTX 780 ₹ 46,170
73.7 FPS
2015 AMD Radeon R9 380X ₹ 16,291
72.2 FPS
2015 AMD Radeon R9 380 ₹ 14,157
69.1 FPS
2016 NVIDIA GeForce GTX 1050 Ti ₹ 12,023
67.8 FPS
2013 AMD Radeon R9 290X ₹ 39,056
67.5 FPS
2012 NVIDIA GeForce GTX 680 ₹ 35,499
67.5 FPS
2012 NVIDIA GeForce GTX 670 ₹ 28,385
64.3 FPS
2014 AMD Radeon R9 285 ₹ 17,714
59.5 FPS
2013 NVIDIA GeForce GTX 770 ₹ 28,385
56.9 FPS

R9 FURY X के बीच बैठता है RX 580 और GTX 1060 3GB , की तुलना में धीमी गिरने RX 580 द्वारा 0.3 % और की तुलना में तेजी GTX 1060 3GB द्वारा 1.8 %। यहां हर ग्राफिक्स कार्ड के मुकाबले इसका औसत सापेक्ष प्रदर्शन है। इसके परिणाम वास्तव में RX 580 से अप्रभेद्य हैं। जिन लोगों के पास रिफ्रेश रेट मॉनीटर है, वे R9 FURY X को औसत 120.06305799783 एफपीएस के रूप में पेश करेंगे। यह एक छोटे अंतर से R9 FURY X और इसके प्रतिद्वंद्वी GTX 980 बीच एक करीबी कॉल है। इसके अलावा, R9 FURY X अच्छे अंतर से R9 390 से भी तेज था।

Cyberpunk 2077 (2020)

उच्च गुणवत्ता

संकल्प 1920x1080

साल ग्राफ़िक्स कार्ड मूल्य फ़्रेम प्रति सेकंड
2016 NVIDIA GeForce GTX 1080 ₹ 35,499
85.8 FPS
2017 AMD Radeon RX Vega 64 ₹ 35,499
82.5 FPS
2017 NVIDIA GeForce GTX 1070 Ti ₹ 29,096
81.9 FPS
2017 AMD Radeon RX Vega 56 ₹ 28,385
80.2 FPS
2015 NVIDIA GeForce GTX TITAN X ₹ 71,069
79.9 FPS
2016 NVIDIA GeForce GTX 1070 ₹ 28,385
76.8 FPS
2015 NVIDIA GeForce GTX 980 Ti ₹ 46,170
64.7 FPS
2015 AMD Radeon R9 FURY X ₹ 46,170
67.3 FPS
2018 AMD Radeon RX 590 ₹ 19,848
63.2 FPS
2015 AMD Radeon R9 Nano ₹ 46,170
60.5 FPS
2014 NVIDIA GeForce GTX 980 ₹ 39,056
59.4 FPS
2015 AMD Radeon R9 FURY ₹ 39,056
57.8 FPS
2017 AMD Radeon RX 580 ₹ 16,291
56.1 FPS
2016 NVIDIA GeForce GTX 1060 6GB ₹ 18,070
55.2 FPS
2014 NVIDIA GeForce GTX TITAN BLACK ₹ 71,069
54.8 FPS
2012 NVIDIA GeForce GTX 690 ₹ 71,069
53.7 FPS
2016 AMD Radeon RX 480 ₹ 28,456
53.2 FPS
2016 NVIDIA GeForce GTX 1060 3GB ₹ 12,094
53.2 FPS
2013 AMD Radeon HD 7990 ₹ 71,069
53.0 FPS
2015 AMD Radeon R9 390X ₹ 30,519
52.9 FPS
2013 NVIDIA GeForce GTX 780 Ti ₹ 49,727
52.2 FPS
2017 AMD Radeon RX 570 ₹ 12,023
52.0 FPS
2013 NVIDIA GeForce GTX TITAN ₹ 71,069
51.5 FPS
2014 NVIDIA GeForce GTX 970 ₹ 23,405
51.0 FPS
2013 AMD Radeon R9 290X ₹ 39,056
50.4 FPS
2015 AMD Radeon R9 390 ₹ 23,405
50.2 FPS
2013 AMD Radeon R9 290 ₹ 28,385
47.4 FPS
2016 AMD Radeon RX 470 ₹ 12,734
46.9 FPS
2013 NVIDIA GeForce GTX 780 ₹ 46,170
43.2 FPS
2012 AMD Radeon HD 7970 GHz Edition ₹ 35,499
39.4 FPS
2015 AMD Radeon R9 380X ₹ 16,291
39.2 FPS
2013 AMD Radeon R9 280X ₹ 21,271
39.0 FPS
2013 NVIDIA GeForce GTX 770 ₹ 28,385
37.5 FPS
2016 NVIDIA GeForce GTX 1050 Ti ₹ 12,023
36.6 FPS
2012 NVIDIA GeForce GTX 680 ₹ 35,499
35.9 FPS
2014 AMD Radeon R9 285 ₹ 17,714
35.2 FPS
2015 AMD Radeon R9 380 ₹ 14,157
35.0 FPS
2012 NVIDIA GeForce GTX 670 ₹ 28,385
33.4 FPS
2012 AMD Radeon HD 7950 ₹ 31,942
30.2 FPS
2012 NVIDIA GeForce GTX 660 Ti ₹ 21,271
29.7 FPS

R9 FURY X के बीच बैठता है GTX 980 Ti और RX 590 , की तुलना में धीमी गिरने GTX 980 Ti द्वारा 1.5 % और की तुलना में तेजी RX 590 द्वारा 0.8 %। यहां प्रत्येक ग्राफिक्स कार्ड के खिलाफ इसका मजबूत सापेक्ष प्रदर्शन है। इसके परिणाम वास्तव में GTX 980 Ti से अप्रभेद्य हैं। R9 FURY X ने औसतन 67.338290890206 एफपीएस इन , GTX 980 को अच्छे अंतर से टॉप किया। इसके अलावा, R9 FURY X अच्छे अंतर से R9 390 से भी तेज था।

Grand Theft Auto V (2015)

उच्च गुणवत्ता

संकल्प 1920x1080

साल ग्राफ़िक्स कार्ड मूल्य फ़्रेम प्रति सेकंड
2016 NVIDIA GeForce GTX 1080 ₹ 35,499
172.5 FPS
2017 NVIDIA GeForce GTX 1070 Ti ₹ 29,096
157.7 FPS
2016 NVIDIA GeForce GTX 1070 ₹ 28,385
147.8 FPS
2017 AMD Radeon RX Vega 64 ₹ 35,499
135.6 FPS
2017 AMD Radeon RX Vega 56 ₹ 28,385
135.5 FPS
2015 NVIDIA GeForce GTX TITAN X ₹ 71,069
133.8 FPS
2015 NVIDIA GeForce GTX 980 Ti ₹ 46,170
130.5 FPS
2015 AMD Radeon R9 FURY X ₹ 46,170
123.0 FPS
2018 AMD Radeon RX 590 ₹ 19,848
111.4 FPS
2014 NVIDIA GeForce GTX 980 ₹ 39,056
110.4 FPS
2015 AMD Radeon R9 Nano ₹ 46,170
105.2 FPS
2016 NVIDIA GeForce GTX 1060 6GB ₹ 18,070
104.2 FPS
2017 AMD Radeon RX 580 ₹ 16,291
102.2 FPS
2016 NVIDIA GeForce GTX 1060 3GB ₹ 12,094
99.7 FPS
2015 AMD Radeon R9 390X ₹ 30,519
99.4 FPS
2014 NVIDIA GeForce GTX 970 ₹ 23,405
96.6 FPS
2015 AMD Radeon R9 390 ₹ 23,405
95.6 FPS
2013 NVIDIA GeForce GTX TITAN ₹ 71,069
90.0 FPS
2013 NVIDIA GeForce GTX 780 ₹ 46,170
88.9 FPS
2013 AMD Radeon R9 290 ₹ 28,385
88.5 FPS
2017 AMD Radeon RX 570 ₹ 12,023
87.9 FPS
2013 AMD Radeon R9 290X ₹ 39,056
84.0 FPS
2016 AMD Radeon RX 470 ₹ 12,734
84.0 FPS
2013 NVIDIA GeForce GTX 780 Ti ₹ 49,727
78.5 FPS
2015 AMD Radeon R9 380X ₹ 16,291
69.2 FPS
2012 NVIDIA GeForce GTX 680 ₹ 35,499
68.8 FPS
2015 AMD Radeon R9 380 ₹ 14,157
68.1 FPS
2012 NVIDIA GeForce GTX 670 ₹ 28,385
66.4 FPS
2014 AMD Radeon R9 285 ₹ 17,714
65.4 FPS
2016 NVIDIA GeForce GTX 1050 Ti ₹ 12,023
60.7 FPS
2013 NVIDIA GeForce GTX 770 ₹ 28,385
58.7 FPS

R9 FURY X के बीच बैठता है GTX 980 Ti और RX 590 , की तुलना में धीमी गिरने GTX 980 Ti द्वारा 12 % और की तुलना में तेजी RX 590 द्वारा 4.6 %। यहां प्रत्येक ग्राफिक्स कार्ड के खिलाफ इसका मजबूत सापेक्ष प्रदर्शन है। जिन लोगों के पास रिफ्रेश रेट मॉनीटर है, वे R9 FURY X को औसत 123.00821549356 एफपीएस के रूप में पेश करेंगे। R9 FURY X ने औसतन 123.00821549356 एफपीएस इन , GTX 980 को अच्छे अंतर से टॉप किया। इसके अलावा, R9 FURY X अच्छे अंतर से R9 390 से भी तेज था।

Call of Duty Modern Warfare (2019)

उच्च गुणवत्ता

संकल्प 1920x1080

साल ग्राफ़िक्स कार्ड मूल्य फ़्रेम प्रति सेकंड
2016 NVIDIA GeForce GTX 1080 ₹ 35,499
196.7 FPS
2017 AMD Radeon RX Vega 64 ₹ 35,499
189.3 FPS
2017 NVIDIA GeForce GTX 1070 Ti ₹ 29,096
188.1 FPS
2017 AMD Radeon RX Vega 56 ₹ 28,385
184.2 FPS
2015 NVIDIA GeForce GTX TITAN X ₹ 71,069
183.6 FPS
2016 NVIDIA GeForce GTX 1070 ₹ 28,385
176.8 FPS
2015 NVIDIA GeForce GTX 980 Ti ₹ 46,170
149.3 FPS
2015 AMD Radeon R9 FURY X ₹ 46,170
155.2 FPS
2018 AMD Radeon RX 590 ₹ 19,848
146.2 FPS
2015 AMD Radeon R9 Nano ₹ 46,170
140.1 FPS
2014 NVIDIA GeForce GTX 980 ₹ 39,056
137.4 FPS
2015 AMD Radeon R9 FURY ₹ 39,056
133.8 FPS
2017 AMD Radeon RX 580 ₹ 16,291
130.1 FPS
2016 NVIDIA GeForce GTX 1060 6GB ₹ 18,070
127.7 FPS
2014 NVIDIA GeForce GTX TITAN BLACK ₹ 71,069
127.3 FPS
2012 NVIDIA GeForce GTX 690 ₹ 71,069
124.5 FPS
2016 AMD Radeon RX 480 ₹ 28,456
123.6 FPS
2016 NVIDIA GeForce GTX 1060 3GB ₹ 12,094
123.6 FPS
2013 AMD Radeon HD 7990 ₹ 71,069
123.1 FPS
2015 AMD Radeon R9 390X ₹ 30,519
122.7 FPS
2013 NVIDIA GeForce GTX 780 Ti ₹ 49,727
121.2 FPS
2017 AMD Radeon RX 570 ₹ 12,023
120.8 FPS
2013 NVIDIA GeForce GTX TITAN ₹ 71,069
119.8 FPS
2014 NVIDIA GeForce GTX 970 ₹ 23,405
118.5 FPS
2013 AMD Radeon R9 290X ₹ 39,056
117.2 FPS
2015 AMD Radeon R9 390 ₹ 23,405
116.7 FPS
2013 AMD Radeon R9 290 ₹ 28,385
110.4 FPS
2016 AMD Radeon RX 470 ₹ 12,734
109.1 FPS
2013 NVIDIA GeForce GTX 780 ₹ 46,170
100.6 FPS
2012 AMD Radeon HD 7970 GHz Edition ₹ 35,499
92.1 FPS
2015 AMD Radeon R9 380X ₹ 16,291
91.8 FPS
2013 AMD Radeon R9 280X ₹ 21,271
91.0 FPS
2013 NVIDIA GeForce GTX 770 ₹ 28,385
87.4 FPS
2016 NVIDIA GeForce GTX 1050 Ti ₹ 12,023
85.5 FPS
2012 NVIDIA GeForce GTX 680 ₹ 35,499
83.8 FPS
2014 AMD Radeon R9 285 ₹ 17,714
82.3 FPS
2015 AMD Radeon R9 380 ₹ 14,157
82.0 FPS
2012 NVIDIA GeForce GTX 670 ₹ 28,385
78.5 FPS
2012 AMD Radeon HD 7950 ₹ 31,942
70.8 FPS
2012 NVIDIA GeForce GTX 660 Ti ₹ 21,271
69.8 FPS

R9 FURY X के बीच बैठता है GTX 980 Ti और RX 590 , की तुलना में धीमी गिरने GTX 980 Ti द्वारा 1.5 % और की तुलना में तेजी RX 590 द्वारा 0.6 %। यहां प्रत्येक ग्राफिक्स कार्ड के खिलाफ इसका मजबूत सापेक्ष प्रदर्शन है। इसके परिणाम वास्तव में GTX 980 Ti से अप्रभेद्य हैं। जिन लोगों के पास रिफ्रेश रेट मॉनीटर है, वे R9 FURY X को औसत 155.17438951191 एफपीएस के रूप में पेश करेंगे। R9 FURY X ने औसतन 155.17438951191 एफपीएस इन , GTX 980 को अच्छे अंतर से टॉप किया। इसके अलावा, R9 FURY X अच्छे अंतर से R9 390 से भी तेज था।

सेटिंग में उच्च गुणवत्ता खेल प्रदर्शन

गुणवत्ता सेटिंग्स परिवर्तित करें

संकल्प 1920x1080

1% Low [Min FPS] Average FPS
साल खेल फ़्रेम प्रति सेकंड
2023 Resident Evil 4
102
113.7
2023 A Plague Tale: Requiem
73
81.9
2023 Hogwarts Legacy
65
72.5
2023 The Last of Us Part I
51
57.8
2023 Forspoken
59
65.6
2023 The Callisto Protocol
47
52.7
2023 Dead Space
73
81.9
2023 Baldur's Gate 3
85
94.9
2023 Armored Core VI
85
94.9
2023 Immortals of Aveum
42
47.6
2023 Ratchet and Clank Rift Apart
77
86.5
2023 Remnant II
47
52.7
2023 Star Wars Jedi: Survivor
60
67.7
2023 Atomic Heart
60
67.7
2023 Starfield
33
37.0
2022 Elden Ring
75
83.8
2022 God of War
72
80.2
2022 Overwatch 2
122
136.0
2022 F1 22
86
95.8
2022 Dying Light 2
82
91.2
2022 Total War: Warhammer III
82
91.2
2022 Spider-Man Remastered
125
139.4
2022 Call of Duty: Modern Warfare II
94
104.8
2021 Forza Horizon 5
72
81.0
2021 Halo Infinite
57
64.0
2021 Battlefield 2042
97
108.6
2021 Hitman 3
106
118.1
2021 Far Cry 6
99
111.0
2021 Guardians of the Galaxy
107
119.6
2020 Watch Dogs: Legion
108
120.6
2020 Assassin's Creed Valhalla
60
67.3
2020 Microsoft Flight Simulator
41
46.5
2020 Valorant
211
235.2
2020 Call of Duty: Black Ops Cold War
96
107.1
2020 Death Stranding
108
121.0
2020 Marvel's Avengers
75
83.8
2020 Godfall
106
118.2
2020 Cyberpunk 2077
60
67.3
2019 Apex Legends
125
139.2
2019 Anthem
86
95.8
2019 Far Cry New Dawn
119
132.6
2019 Resident Evil 2
140
156.5
2019 Metro Exodus
70
78.7
2019 World War Z
144
160.6
2019 Gears of War 5
97
108.6
2019 F1 2019
118
131.6
2019 GreedFall
108
120.3
2019 Borderlands 3
80
88.9
2019 Call of Duty Modern Warfare
139
155.2
2019 Red Dead Redemption 2
61
68.8
2019 Need For Speed: Heat
91
101.5
2018 Call of Duty: Black Ops 4
133
147.8
2018 Assassin's Creed Odyssey
67
74.7
2018 Final Fantasy XV
105
117.0
2018 Shadow of the Tomb Raider
91
101.8
2018 Forza Horizon 4
108
120.1
2018 Fallout 76
117
130.4
2018 Hitman 2
95
106.4
2018 Just Cause 4
96
107.7
2018 Monster Hunter: World
103
114.7
2018 Strange Brigade
146
162.5
2018 Battlefield V
131
146.3
2017 Dawn of War III
143
159.4
2017 Ghost Recon Wildlands
99
111.0
2017 Assassin's Creed Origins
91
101.8
2017 Destiny 2
159
177.3
2017 PlayerUnknown's Battlegrounds
97
107.8
2017 Fortnite Battle Royale
108
120.9
2017 Need For Speed: Payback
127
142.0
2017 For Honor
162
180.8
2017 Project CARS 2
121
135.3
2017 Forza Motorsport 7
143
159.2
2016 Ashes of the Singularity
110
122.6
2016 Deus Ex: Mankind Divided
94
105.0
2016 Ashes of the Singularity: Escalation
107
119.8
2016 Doom
201
224.3
2016 F1 2016
139
154.8
2016 Hitman
147
163.8
2016 Rise of the Tomb Raider
106
118.7
2016 The Division
119
132.7
2016 Total War: Warhammer
120
133.5
2016 Battlefield 1
151
168.9
2016 Overwatch
157
175.1
2016 Dishonored 2
93
103.5
2015 DiRT Rally
185
206.3
2015 Grand Theft Auto V
110
123.0
2015 The Witcher 3
106
118.2
2015 Total War: Attila
98
110.0
2015 Rocket League
392
435.6
2015 Need For Speed
136
151.3
2015 Project CARS
131
145.9
2015 Rainbow Six Siege
217
241.7
2014 Civilization: Beyond Earth
179
199.7
2014 Dragon Age: Inquisition
135
150.5
2014 Far Cry 4
115
127.9
2014 GRID Autosport
125
139.0
2014 Shadow of Mordor
162
180.8
2014 The Talos Principle
183
204.1
2013 Crysis 3
117
131.1
2013 Battlefield 4
143
159.4
2012 Counter-Strike: Global Offensive
288
321.0
2009 League of Legends
479
532.3

संकल्प 2560x1440

1% Low [Min FPS] Average FPS
साल खेल फ़्रेम प्रति सेकंड
2023 Resident Evil 4
67
84.3
2023 A Plague Tale: Requiem
48
61.0
2023 Hogwarts Legacy
44
56.1
2023 The Last of Us Part I
35
44.2
2023 Forspoken
35
44.2
2023 The Callisto Protocol
30
38.0
2023 Dead Space
44
56.1
2023 Baldur's Gate 3
61
77.0
2023 Armored Core VI
61
77.0
2023 Immortals of Aveum
27
33.8
2023 Ratchet and Clank Rift Apart
48
61.0
2023 Remnant II
28
36.1
2023 Star Wars Jedi: Survivor
41
51.4
2023 Atomic Heart
39
49.2
2023 Starfield
26
32.9
2022 Elden Ring
53
66.7
2022 God of War
54
68.4
2022 Overwatch 2
93
116.5
2022 F1 22
48
61.0
2022 Dying Light 2
48
61.0
2022 Total War: Warhammer III
52
65.8
2022 Spider-Man Remastered
81
102.1
2022 Call of Duty: Modern Warfare II
56
70.5
2021 Forza Horizon 5
55
69.2
2021 Halo Infinite
45
57.1
2021 Battlefield 2042
59
74.4
2021 Hitman 3
68
86.1
2021 Far Cry 6
67
84.3
2021 Guardians of the Galaxy
69
87.0
2020 Watch Dogs: Legion
65
81.6
2020 Assassin's Creed Valhalla
46
57.9
2020 Microsoft Flight Simulator
32
40.3
2020 Valorant
155
193.9
2020 Call of Duty: Black Ops Cold War
67
84.6
2020 Death Stranding
75
94.9
2020 Marvel's Avengers
48
60.8
2020 Godfall
65
81.7
2020 Cyberpunk 2077
49
61.8
2019 Apex Legends
84
105.5
2019 Anthem
61
76.5
2019 Far Cry New Dawn
83
104.1
2019 Resident Evil 2
87
109.1
2019 Metro Exodus
49
61.8
2019 World War Z
95
119.9
2019 Gears of War 5
64
80.2
2019 F1 2019
76
95.6
2019 GreedFall
71
88.8
2019 Borderlands 3
51
64.0
2019 Call of Duty Modern Warfare
91
114.6
2019 Red Dead Redemption 2
44
56.1
2019 Need For Speed: Heat
64
80.2
2018 Call of Duty: Black Ops 4
74
93.0
2018 Assassin's Creed Odyssey
47
59.5
2018 Final Fantasy XV
68
85.2
2018 Shadow of the Tomb Raider
58
72.7
2018 Forza Horizon 4
81
102.1
2018 Fallout 76
100
125.5
2018 Hitman 2
56
70.9
2018 Just Cause 4
64
81.1
2018 Monster Hunter: World
65
82.5
2018 Strange Brigade
93
116.5
2018 Battlefield V
94
118.4
2017 Dawn of War III
108
135.2
2017 Ghost Recon Wildlands
70
88.6
2017 Assassin's Creed Origins
65
82.2
2017 Destiny 2
120
150.9
2017 PlayerUnknown's Battlegrounds
66
83.7
2017 Fortnite Battle Royale
65
81.9
2017 Need For Speed: Payback
83
105.0
2017 For Honor
89
111.7
2017 Project CARS 2
78
98.0
2017 Forza Motorsport 7
113
142.1
2016 Ashes of the Singularity
85
106.7
2016 Deus Ex: Mankind Divided
60
75.4
2016 Ashes of the Singularity: Escalation
86
108.0
2016 Doom
131
164.6
2016 F1 2016
103
128.9
2016 Hitman
105
132.3
2016 Rise of the Tomb Raider
73
91.8
2016 The Division
82
102.9
2016 Total War: Warhammer
85
106.3
2016 Battlefield 1
105
132.4
2016 Overwatch
99
124.8
2016 Dishonored 2
70
88.2
2015 DiRT Rally
125
156.8
2015 Grand Theft Auto V
73
91.5
2015 The Witcher 3
75
94.4
2015 Total War: Attila
65
82.2
2015 Rocket League
169
212.3
2015 Need For Speed
94
118.5
2015 Project CARS
90
113.1
2015 Rainbow Six Siege
131
163.8
2014 Civilization: Beyond Earth
131
164.2
2014 Dragon Age: Inquisition
88
111.1
2014 Far Cry 4
103
129.1
2014 GRID Autosport
110
137.8
2014 Shadow of Mordor
111
139.4
2014 The Talos Principle
124
156.2
2013 Crysis 3
75
94.0
2013 Battlefield 4
90
113.7
2012 Counter-Strike: Global Offensive
215
269.4
2009 League of Legends
258
323.4

संकल्प 3440x1440

1% Low [Min FPS] Average FPS
साल खेल फ़्रेम प्रति सेकंड
2019 Apex Legends
69
91.9
2019 Anthem
49
64.7
2019 Far Cry New Dawn
66
87.4
2019 Resident Evil 2
68
89.8
2019 Metro Exodus
41
54.5
2019 World War Z
78
103.4
2019 Gears of War 5
54
71.3
2019 F1 2019
64
85.0
2019 GreedFall
52
69.5
2019 Borderlands 3
40
53.4
2019 Call of Duty Modern Warfare
75
99.9
2019 Red Dead Redemption 2
37
49.9
2019 Need For Speed: Heat
54
71.3
2018 Call of Duty: Black Ops 4
64
84.3
2018 Assassin's Creed Odyssey
41
55.0
2018 Final Fantasy XV
56
74.2
2018 Shadow of the Tomb Raider
45
60.3
2018 Forza Horizon 4
69
91.8
2018 Fallout 76
81
107.0
2018 Hitman 2
47
61.9
2018 Just Cause 4
51
67.8
2018 Monster Hunter: World
51
67.2
2018 Strange Brigade
75
98.7
2018 Battlefield V
70
92.5
2017 Dawn of War III
84
111.6
2017 Ghost Recon Wildlands
59
78.1
2017 Assassin's Creed Origins
55
72.5
2017 Destiny 2
94
124.8
2017 PlayerUnknown's Battlegrounds
54
71.6
2017 Fortnite Battle Royale
52
68.8
2017 Need For Speed: Payback
73
96.1
2017 For Honor
70
92.4
2017 Project CARS 2
73
96.1
2017 Forza Motorsport 7
106
139.8
2016 Ashes of the Singularity
77
101.8
2016 Deus Ex: Mankind Divided
47
62.7
2016 Ashes of the Singularity: Escalation
79
104.7
2016 Doom
105
138.9
2016 F1 2016
87
115.1
2016 Hitman
87
115.5
2016 Rise of the Tomb Raider
62
82.8
2016 The Division
68
90.6
2016 Total War: Warhammer
69
91.8
2016 Battlefield 1
86
114.4
2016 Overwatch
78
103.9
2016 Dishonored 2
64
84.9
2015 DiRT Rally
102
135.3
2015 Grand Theft Auto V
58
76.5
2015 The Witcher 3
63
83.8
2015 Total War: Attila
52
69.2
2015 Rocket League
131
172.9
2015 Need For Speed
81
107.1
2015 Project CARS
79
104.2
2015 Rainbow Six Siege
100
132.9
2014 Civilization: Beyond Earth
113
149.6
2014 Dragon Age: Inquisition
78
102.8
2014 Far Cry 4
84
111.6
2014 GRID Autosport
97
128.9
2014 Shadow of Mordor
91
120.5
2014 The Talos Principle
103
136.4
2013 Crysis 3
59
78.1
2013 Battlefield 4
82
108.4
2012 Counter-Strike: Global Offensive
206
272.3
2009 League of Legends
193
254.3

संकल्प 3840x2160

1% Low [Min FPS] Average FPS
साल खेल फ़्रेम प्रति सेकंड
2023 Resident Evil 4
45
65.4
2023 A Plague Tale: Requiem
28
40.9
2023 Hogwarts Legacy
28
40.9
2023 The Last of Us Part I
17
25.1
2023 Forspoken
15
22.8
2023 The Callisto Protocol
14
20.6
2023 Dead Space
17
25.1
2023 Baldur's Gate 3
32
46.0
2023 Armored Core VI
32
46.0
2023 Immortals of Aveum
11
17.1
2023 Ratchet and Clank Rift Apart
25
35.9
2023 Remnant II
13
19.4
2023 Star Wars Jedi: Survivor
19
27.3
2023 Atomic Heart
22
32.7
2023 Starfield
15
22.8
2022 Elden Ring
28
40.6
2022 God of War
38
54.7
2022 Overwatch 2
63
91.2
2022 F1 22
32
46.0
2022 Dying Light 2
32
46.0
2022 Total War: Warhammer III
35
51.0
2022 Spider-Man Remastered
52
74.8
2022 Call of Duty: Modern Warfare II
32
46.0
2021 Forza Horizon 5
38
55.2
2021 Halo Infinite
28
40.9
2021 Battlefield 2042
35
50.6
2021 Hitman 3
39
56.0
2021 Far Cry 6
34
49.1
2021 Guardians of the Galaxy
35
51.0
2020 Watch Dogs: Legion
39
56.0
2020 Assassin's Creed Valhalla
28
40.9
2020 Microsoft Flight Simulator
22
32.7
2020 Valorant
120
171.6
2020 Call of Duty: Black Ops Cold War
34
49.1
2020 Death Stranding
43
61.5
2020 Marvel's Avengers
24
34.5
2020 Godfall
29
42.8
2020 Cyberpunk 2077
29
42.7
2019 Apex Legends
47
67.3
2019 Anthem
31
44.9
2019 Far Cry New Dawn
42
60.0
2019 Resident Evil 2
41
59.1
2019 Metro Exodus
28
40.9
2019 World War Z
52
74.4
2019 Gears of War 5
37
53.7
2019 F1 2019
45
64.3
2019 GreedFall
28
40.9
2019 Borderlands 3
25
36.1
2019 Call of Duty Modern Warfare
51
73.1
2019 Red Dead Redemption 2
26
37.7
2019 Need For Speed: Heat
37
53.7
2018 Call of Duty: Black Ops 4
46
65.8
2018 Assassin's Creed Odyssey
30
44.0
2018 Final Fantasy XV
37
54.2
2018 Shadow of the Tomb Raider
28
40.4
2018 Forza Horizon 4
49
70.6
2018 Fallout 76
52
75.4
2018 Hitman 2
31
45.7
2018 Just Cause 4
32
45.9
2018 Monster Hunter: World
30
43.5
2018 Strange Brigade
48
68.9
2018 Battlefield V
37
54.2
2017 Dawn of War III
51
73.6
2017 Ghost Recon Wildlands
40
58.4
2017 Assassin's Creed Origins
37
54.2
2017 Destiny 2
58
83.2
2017 PlayerUnknown's Battlegrounds
35
50.9
2017 Fortnite Battle Royale
32
47.1
2017 Need For Speed: Payback
53
76.2
2017 For Honor
42
61.3
2017 Project CARS 2
58
83.4
2017 Forza Motorsport 7
85
121.9
2016 Ashes of the Singularity
59
85.2
2016 Deus Ex: Mankind Divided
29
41.8
2016 Ashes of the Singularity: Escalation
62
89.5
2016 Doom
67
96.1
2016 F1 2016
61
87.9
2016 Hitman
59
84.9
2016 Rise of the Tomb Raider
44
64.2
2016 The Division
47
67.3
2016 Total War: Warhammer
46
66.1
2016 Battlefield 1
57
82.6
2016 Overwatch
49
70.3
2016 Dishonored 2
50
71.7
2015 DiRT Rally
68
97.7
2015 Grand Theft Auto V
36
52.0
2015 The Witcher 3
44
63.5
2015 Total War: Attila
33
47.6
2015 Rocket League
77
111.1
2015 Need For Speed
58
83.4
2015 Project CARS
58
83.4
2015 Rainbow Six Siege
59
84.7
2014 Civilization: Beyond Earth
82
117.5
2014 Dragon Age: Inquisition
57
82.8
2014 Far Cry 4
56
80.5
2014 GRID Autosport
73
105.4
2014 Shadow of Mordor
60
86.8
2014 The Talos Principle
70
100.3
2013 Crysis 3
36
52.5
2013 Battlefield 4
63
91.0
2012 Counter-Strike: Global Offensive
171
245.7
2009 League of Legends
105
150.4
R9 FURY X with Core i5-12600K at 1080p and उच्च गुणवत्ता settings
R9 FURY X with Core i5-12600K at 1440p and उच्च गुणवत्ता settings
R9 FURY X with Core i5-12600K at 4K and उच्च गुणवत्ता settings

प्रतिस्पर्धियों के खिलाफ तुलना

R9 FURY X विनिर्देशों

R9 FURY X Board Design

Board NumberC88001
Length7.5 inches 191 mm
Outputs1x HDMI3x DisplayPort
Power Connectors2x 8-pin
Slot WidthDual-slot
TDP275 W

R9 FURY X Clock Speeds

GPU Clock1050 MHz
Memory Clock500 MHz 1000 MHz effective

R9 FURY X Graphics Card

Bus InterfacePCIe 3.0 x16
GenerationPirate Islands (R9 300)
Launch Price649 USD
ProductionActive
Release DateJun 24th, 2015

R9 FURY X Graphics Features

DirectX12.0 (12_0)
OpenCL2
OpenGL4.5
Shader Model6
Vulkan1.1.82

R9 FURY X Graphics Processor

ArchitectureGCN 3.0
Die Size596 mm²
GPU NameFiji
GPU VariantFiji XT C8 (215-0862040)
Process Size28 nm
Transistors8,900 million

R9 FURY X Memory

Bandwidth512.0 GB/s
Memory Bus4096 bit
Memory Size4096 MB
Memory TypeHBM

R9 FURY X Render Config

Compute Units64
ROPs64
Shading Units4096
TMUs256

R9 FURY X Theoretical Performance

FP16 (half) performance8,602 GFLOPS (1:1)
FP32 (float) performance8,602 GFLOPS
FP64 (double) performance537.6 GFLOPS (1:16)
Pixel Rate67.20 GPixel/s
Texture Rate268.8 GTexel/s

Critics Reviews

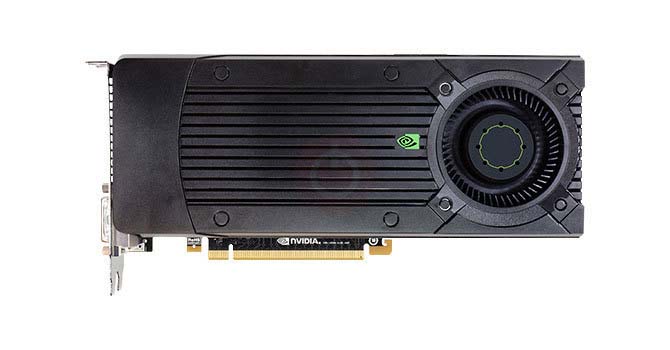
The Fury X uses an all-new chunk of silicon dubbed Fiji, as opposed to the die in the Radeon R9 290X, which was called Hawaii. Fiji is the beefiest GPU AMD has ever crafted, and it sports a ...
Conclusion: Fiji delivers, but also faces formidable competition. Unfortunately we are bringing you our Radeon R9 Fury X review a week late. AMD had limited samples ready for the release and only ...
Like the R9 295X2, the Fury X also features a red glowing Radeon logo across the top of the graphics card when powered on. In addition to the glowing logo, the Fury X features AMD's new GPU Tach LEDs.
While AMD introduced its highly anticipated Radeon R9 Fury X in June, we’re taking a deeper look at its power consumption and pump noise. Since we were able to procure our own retail board, we ...
The AMD Radeon R9 Fury X also supports the Asynchronous Shader technology AMD talked about recently. Asynchronous Shaders are a feature of new or next-gen APIs like DirectX 12, Vulkan, and AMD’s ...
AMD's Radeon R9 Fury X is released today, introducing HBM memory for graphics cards. The new card is built around a watercooled Fiji GPU, which enabled AMD to design a very compact card that will fit into many small-form-factor cases. Gaming performance at 4K is good and roughly matches the GTX 980 Ti.
AMD's Fiji GPU is finally here, in the form of a new flagship, liquid-cooled graphics card: Fury X
Radeon R9 Fury X specs. The Fiji processor in the R9 Fury X is based on AMD's third generation GCN architecture, previously found in the R9 295/380, and codenamed Tonga.
Conclusion. AMD is putting reviewers in a tough spot with Fury. On one hand, the Fiji GPU with HBM is a remarkable feat of engineering. ... I really like Sapphire’s Radeon R9 Fury Tri-X. The ...
AMD Radeon R9 Fury X – Under the Hood The R9 Fury X uses a brand-new GPU dubbed Fiji, but it’s based on the Graphics Core Next architecture that’s been inside AMD chips since 2011.
Radeon R9 Fury X benchmarks . As far as the games go, we used the in-game benchmarks provided with each, utilizing the stock graphics settings mentioned unless otherwise noted.
Catching up to the present, this month marks an important occasion for AMD with the launch of their new flagship GPU, Fiji, and the flagship video card based on it, the Radeon R9 Fury X.
The Radeon R9 FURY X is a high-end graphics card by AMD, launched in June 2015. Built on the 28 nm process, and based on the Fiji graphics processor, in its Fiji XT C8 variant, the card supports DirectX 12.0.
AMD Radeon R9 Fury X Radeon R9 290X Nvidia GeForce GTX 980 Ti. GeForce GTX 980. MORE: Best Graphics Cards For The Money ... The Radeon R9 Fury X is born of the same DNA, with Graphics Core Next in ...
AMD says the Fury X is a reference design only, though the air-cooled Radeon R9 Fury scheduled for a July 14 release will have vendor-customized designs available.
Given the Radeon Fury X has the same board-power rating as the R9 290X, AMD also gave it a liquid-cooling solution in an effort to clinch the heat-and-noise game against NVIDIA's high-end "Maxwell" GPUs, including the GTX Titan X and the more recently launched GTX 980 Ti.

चर्चा और टिप्पणियाँ

अपनी टिप्पणियाँ साझा करें