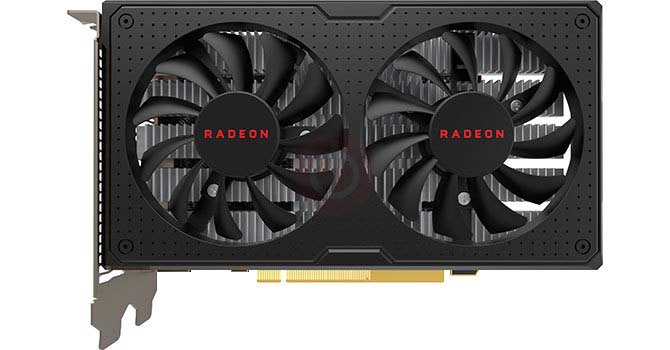
R9 390 עם Core i9-14900K ביצועים איכות נמוכה באיכות הגדרות
בעיקרו של R9 390 דבר, עדיין מסוגל לשחק משחקים מודרניים, אבל אתה צריך להפחית את ההגדרות כדי לשמור על framerates גבוהה יותר. אם שמירה על איכות גרפיקה הגדרות קרוב אולטרה או גבוה הוא חשוב, יש כמה אפשרויות עבור שדרוגים. נראה כי R9 390 הוא מסוגל יותר כרטיס אמצע טווח שיכול לשחק כותרים AAA ב 1080p עם 60 מסגרות לשנייה. ראוי לציין כי R9 390 הוא כרטיס רעב כוח מאוד דורש יחידת ספק כוח סביר. במונחים של זיכרון, R9 390 8192 MB זיכרון RAM הוא יותר ממספיק עבור משחקים מודרניים לא צריך לגרום לצוואר בקבוק.
The release year of the graphics card. The newer the better technology and performance optimization and
driver support.
Year
2016
2019
13
2015
2016
11
2014
2015
8
2013
2014
4
2007
2013
2
The price of the graphics card. The cheaper the better.
Price
0
250
35
250
400
30
400
550
25
550
650
15
650
9999
5
Power Supply Wattage required for overall system. The lower the better.
PSU
0
350
4
350
450
4
450
550
3
550
650
2
650
9999
1
Maximum recorded temperature under load. The lower the better for longer life of the graphics card.
Temp
0
70
2
70
75
2
75
80
1
80
85
1
85
999
1
Noise Levels under load. The lower the better.
Noise
0
45
2
45
48
2
48
50
2
50
55
1
55
999
1
Full HD performance at 1080p resolution. The higher the better.
FHD
60
9999
18
55
60
13
45
55
11
35
45
7
0
35
5
Quad HD performance at 1440p resolution. The higher the better.
QHD
60
9999
10
55
60
8
45
55
5
35
45
4
0
35
2
4K performance at 2160p resolution. The higher the better.
F4K
60
9999
5
55
60
4
45
55
3
35
45
2
0
35
1
Current CPU Impact on performance with respect to the highest performing CPU used for benchmark at the
time this graphics card was released.
CPU
-5
9999
5
-7
-5
4
-10
-7
3
-15
-10
2
-9999
-15
1
Graphics card memory (RAM) capacity. The higher the better for higher resolution textures and future
demanding games.
MEM
8
9999
5
4
8
4
2
4
3
1
2
2
0
1
1
FROM
TO
VERDICT
The overall score is determined based on the calculated weightings for the individual components.
OVERALL SCORE
80
99
Excellent
70
80
Very Good
60
70
Good
40
60
Acceptable
0
40
Weak
83/100
מעולה
החדשות הטובות הן, עם פרסום R9 390X, המחיר של R9 390 מקבל הנחה רבה יותר. כרטיסי xx90 AMD xx90 הוגדרו תמיד על ידי מחירי high-end עם ביצועים extreme על הדלת של כרטיסי הגרפיקה extreme - במיוחד כאשר הם extreme. לאחר שהקדשנו את הזמן לבחינה מלאה של כרטיס המסך GCN 2.0 בתוך R9 390, אנו יכולים לומר ללא ספק שהוא ממשיך את המגמה.
R9 390 זול בהרבה מ- R9 290 מכיוון שהוא עולה ₪ 1240.3. השווה זאת ל R9 290, AMD Radeon R9 290X שהגיע במקור במחיר של ₪ 1504.2, ₪ 2069.7. בינתיים, NVIDIA הכרטיס המקביל הקרוב הוא GTX 980 שעולה ₪ 2069.7. ספציפית למפרט, R9 390 R9 290 את קודמו הישיר, R9 290, על ידי התפארות ב- 3.3 % יותר fps.
ל R9 390 יש 8 GB לעומת זיכרון R9 290 של 4. בהשוואה שלה NVIDIA "s הקרוב יריב, GTX 980, את R9 390 היה -19.1 % איטי יותר.
לגבי 1080p Full HD הצלחנו לשחק Apex Legends, Call of Duty Modern Warfare, Resident Evil 2, Strange Brigade, Valorant ב 63 fps עד 115 fps ו- שמרנו על שיעורי המסגרות סביב 79 fps. לגבי 1440p Quad HD הצלחנו לשחק Valorant ב 94 fps עד 94 fps ו- שמרנו על שיעורי המסגרות סביב 94 fps.
לגבי 2160p 4K הצלחנו לשחק Valorant ב 82 fps עד 82 fps ו- שמרנו על שיעורי המסגרות סביב 82 fps.
R9 390 יושב בין R9 290X ל- R9 290 , נופל לאט יותר מ- R9 290X ב- 0.3 % ומהיר יותר מ- R9 290 ב- 5.4 %. יש לו ביצועים יחסית ממוצעים לעומת כל כרטיס גרפי כאן. תוצאותיה למעשה לא ניתנות להבחנה R9 290X של R9 290X . מי שיש לו צג קצב רענון גבוה, יהנה ממה שיש ל- R9 390 להציע כי הוא ממוצע של 130.964540885 fps. בנוסף, R9 390 היה גם מהיר יותר מ- R9 290 בהפרש טוב. בהשוואה R9 380 התחתון - R9 380 - אנו רואים ביצועים מהירים יותר מ- 20% עבור R9 390 .
R9 390 יושב בין R9 290 ל- RX 570 , נופל לאט יותר מ- R9 290 ב- 1.4 % ומהיר יותר מ- RX 570 ב- 0 %. יש לו ביצועים יחסית ממוצעים לעומת כל כרטיס גרפי כאן. תוצאותיה למעשה לא ניתנות להבחנה R9 290 של R9 290 . מי שיש לו צג קצב רענון גבוה, יהנה ממה שיש ל- R9 390 להציע כי הוא ממוצע של 219.71483654489 fps. כנגד יריבו - GTX 980 , R9 390 איטי בהרבה. בהשוואה R9 380 התחתון - R9 380 - אנו רואים ביצועים מהירים יותר מ- 20% עבור R9 390 .
R9 390 יושב בין R9 290X ל- R9 290 , נופל לאט יותר מ- R9 290X ב- 0.3 % ומהיר יותר מ- R9 290 ב- 5.4 %. יש לו ביצועים יחסית ממוצעים לעומת כל כרטיס גרפי כאן. תוצאותיה למעשה לא ניתנות להבחנה R9 290X של R9 290X . מי שיש לו צג קצב רענון גבוה, יהנה ממה שיש ל- R9 390 להציע כי הוא ממוצע של 130.964540885 fps. בנוסף, R9 390 היה גם מהיר יותר מ- R9 290 בהפרש טוב. בהשוואה R9 380 התחתון - R9 380 - אנו רואים ביצועים מהירים יותר מ- 20% עבור R9 390 .
R9 390 יושב בין GTX 970 ל- GTX 780 , נופל לאט יותר מ- GTX 970 ב- 0.9 % ומהיר יותר מ- GTX 780 ב- 6.5 %. יש לו ביצועים יחסית ממוצעים לעומת כל כרטיס גרפי כאן. תוצאותיה למעשה לא ניתנות להבחנה GTX 970 של GTX 970 . מי שיש לו צג קצב רענון גבוה, יהנה ממה שיש ל- R9 390 להציע כי הוא ממוצע של 230.76996296164 fps. בנוסף, R9 390 היה גם מהיר יותר מ- R9 290 בהפרש טוב. בהשוואה R9 380 התחתון - R9 380 - אנו רואים ביצועים מהירים יותר מ- 20% עבור R9 390 .
R9 390 יושב בין R9 290X ל- R9 290 , נופל לאט יותר מ- R9 290X ב- 0.4 % ומהיר יותר מ- R9 290 ב- 4.8 %. יש לו ביצועים יחסית ממוצעים לעומת כל כרטיס גרפי כאן. תוצאותיה למעשה לא ניתנות להבחנה R9 290X של R9 290X . מי שיש לו צג קצב רענון גבוה, יהנה ממה שיש ל- R9 390 להציע כי הוא ממוצע של 273.39751829125 fps. בנוסף, R9 390 היה גם מהיר יותר מ- R9 290 בהפרש טוב. בהשוואה R9 380 התחתון - R9 380 - אנו רואים ביצועים מהירים יותר מ- 20% עבור R9 390 .
Conclusion. In the end, drawing a sweeping conclusion is difficult when there’s no actual reference graphics card. The next best approach is evaluating cards from AMD’s partners.
The R9 390 is AMD's rival to the Nvidia GTX 970 that's ideal for 1440p gaming, but it draws a lot of power for the performance you get. ... AMD Radeon R9 390 – Under the Hood ... Verdict. Given ...
AMD Radeon R9 390X – Results Analysis. ... Verdict. The R9 390X is designed to take on the GTX 980, and it does an excellent job. It’s almost £50 cheaper than Nvidia’s card and, in many ...
AMD Radeon R9 380: Tonga Makes the Switch from R9 285 to R9 380 Antigua Pro (previously called Tonga ) makes a reappearance as well in the Radeon R9 380. This card is another rebrand, plain and ...
The Radeon R9 390 and Radeon R9 390 are positioned against the GeForce GTX 980 and GeForce GTX 970. The R9 390X is a bit slower than the GeForce GTX 980 but features a larger VRAM and has a lower ...
The R9 390 is AMD's rival to the Nvidia GTX 970 that's ideal for 1440p gaming, but it draws a lot of power for the performance you get.
Radeon R9 390 Series: Return To Hawaii. Last but not least among the numbered 300 series stack are the top two cards and the only cards not to exist in some form in the OEM lineup, the R9 390 and ...
AMD is pleased to bring you the new R9 390 series which has been in development for a little over a year now. To clarify, the new R9 390 comes standard with 8GB of GDDR5 memory and outpaces the 290X.


מה לשקול לפני רכישת כרטיס המסך
אם אתה כבר מתכנן לשדרג את המערכת על ידי רכישת כרטיס גרפיקה חדשה. אז יש כמה גורמים חשובים שיש לקחת בחשבון.
רזולוציה VS איכות: השפעה על ביצועי המשחק
מה משפיע על ביצועי המשחק? בהירות או פרטים?
אולטרה VS באיכות גבוהה הגדרות משחקי מחשב
לכל שחקן יש מושג אחר על ההגדרה האידיאלית למשחקי מחשב. אבל ברוב המקרים, בחירה של תצורה גרפיקה באיכות גבוהה היא הדרך ללכת.
מה הם CPU או GPU Bottlenec?
אתה מקבל טיפות מסגרת פתאומית? אולי יש לך צוואר בקבוק.
מהי מהירות FPS המקובלת עבורי?
עבור כמה משחקים, אתה עדיין יכול ליהנות garphics גדול בשיעורים מסגרת נמוכה.
GPU Hierarchy
GPU Compare
CPU Compare
Gaming Laptops
Gaming Monitors
Gaming Headsets
דיון והערות
שתף את ההערות שלך