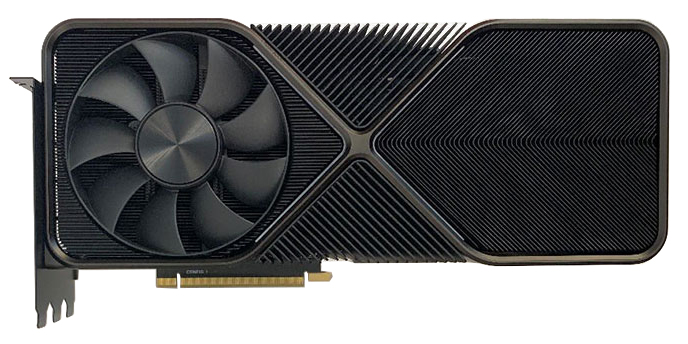
RTX 3080 benchmark with Ryzen 5 1500X 1080p, 1440p, Ultrawide, 4K benchmarks at Low Quality
It is worth noting that the RTX 3080 is a very power hungry card and requires a decent power supply unit. In terms of memory, the RTX 3080 's 10240 MB RAM is more than enough for modern games and should not cause any bottlenecks. This combination between RTX 3080 and AMD Ryzen 5 1500X is going to cause serious bottlenecks in many games and cause severe FPS loss. Deciding whether to invest so much money in a high-end GPU like RTX 3080 requires careful thought. 4K gaming is joyous on this RTX 3080 , and with a little tweaking to your AA settings, it'd be hard to imagine a title not capable of 60 fps on average.
The release year of the graphics card. The newer the better technology and performance optimization and
driver support.
Year
2016
2019
13
2015
2016
11
2014
2015
8
2013
2014
4
2007
2013
2
The price of the graphics card. The cheaper the better.
Price
0
250
35
250
400
30
400
550
25
550
650
15
650
9999
5
Power Supply Wattage required for overall system. The lower the better.
PSU
0
350
4
350
450
4
450
550
3
550
650
2
650
9999
1
Maximum recorded temperature under load. The lower the better for longer life of the graphics card.
Temp
0
70
2
70
75
2
75
80
1
80
85
1
85
999
1
Noise Levels under load. The lower the better.
Noise
0
45
2
45
48
2
48
50
2
50
55
1
55
999
1
Full HD performance at 1080p resolution. The higher the better.
FHD
60
9999
18
55
60
13
45
55
11
35
45
7
0
35
5
Quad HD performance at 1440p resolution. The higher the better.
QHD
60
9999
10
55
60
8
45
55
5
35
45
4
0
35
2
4K performance at 2160p resolution. The higher the better.
F4K
60
9999
5
55
60
4
45
55
3
35
45
2
0
35
1
Current CPU Impact on performance with respect to the highest performing CPU used for benchmark at the
time this graphics card was released.
CPU
-5
9999
5
-7
-5
4
-10
-7
3
-15
-10
2
-9999
-15
1
Graphics card memory (RAM) capacity. The higher the better for higher resolution textures and future
demanding games.
MEM
8
9999
5
4
8
4
2
4
3
1
2
2
0
1
1
FROM
TO
VERDICT
The overall score is determined based on the calculated weightings for the individual components.
OVERALL SCORE
80
99
Excellent
70
80
Very Good
60
70
Good
40
60
Acceptable
0
40
Weak
65/100
Good
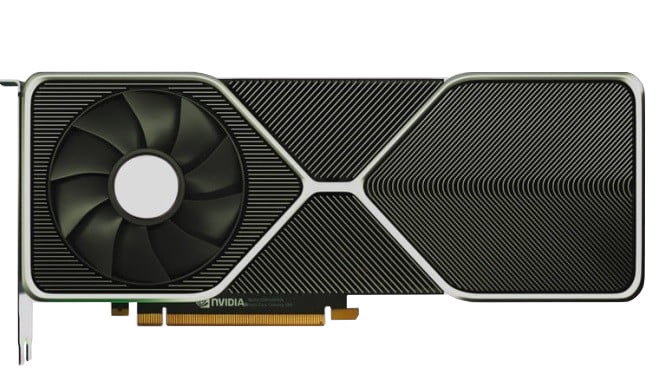
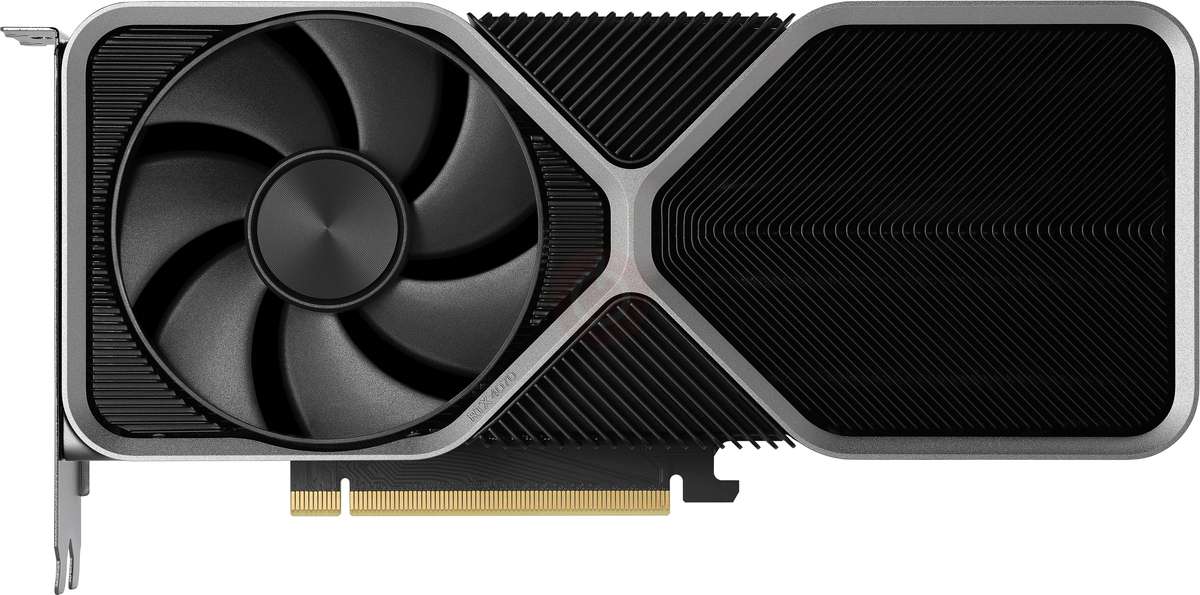
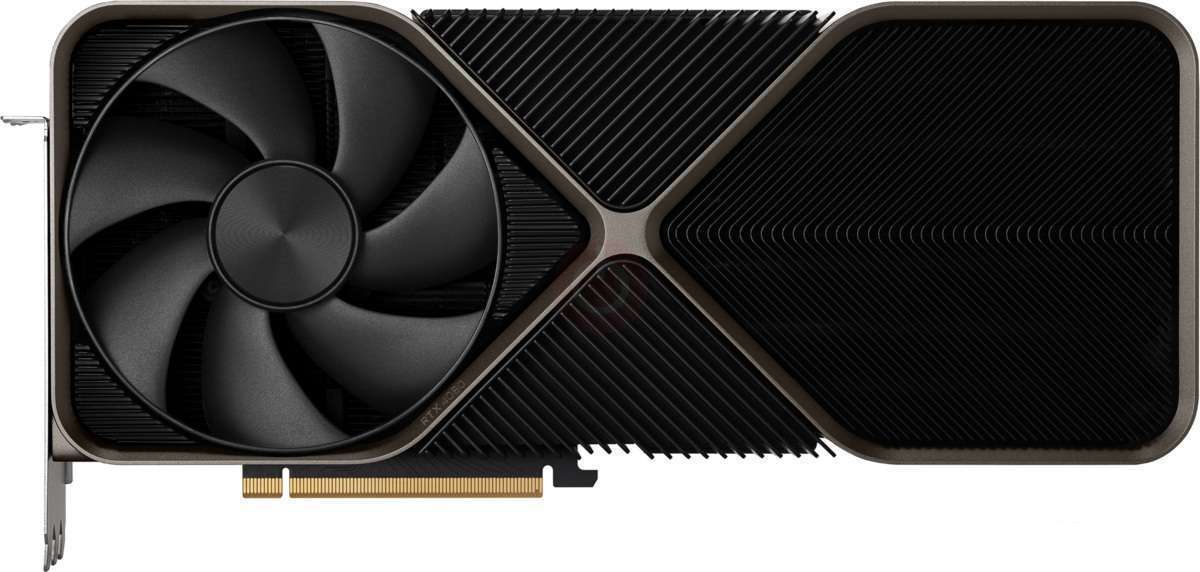
The RTX 3090 might be the extreme flagship of the latest Ampere set of graphics cards, but their prices keep them out of the reach of most high-end PC gamers. On the other hand, the RTX 3080 is closer to being reasonably affordable at a price tag of $ 699. The good news is, with the release of the RTX 3080 Ti, the RTX 3080 's price is getting more discount.
Spec for spec, this RTX 3080 leapfrogs its direct predecessor, the RTX 2080, by boasting 69.4 % more fps. The RTX 3080 has 10 GB RAM compared to the RTX 2080 's 8 GB video memory.
Fortunately, gaming performance was quite impressive. The RTX 3080 consistently delivers great frame rate increases over the RTX 2080, NVIDIA GeForce RTX 2080 Ti and it really justifies an upgrade. Compared to its AMD 's closest rival, RX 6800 XT, the RTX 3080 was -1.6 % slower.
For 1080p Full HD, we were able to play Microsoft Flight Simulator, Immortals of Aveum, The Callisto Protocol, Remnant II, The Last of Us Part I at 67 fps to 85 fps and kept frame rates hovering around 75 fps. For 1440p Quad HD, we were able to play The Last of Us Part I, Forspoken, Atomic Heart, Star Wars Jedi: Survivor, Hogwarts Legacy at 65 fps to 85 fps and kept frame rates hovering around 73 fps.
For 2160p 4K, we were able to play Halo Infinite, Assassin's Creed Valhalla, GreedFall, Cyberpunk 2077, Godfall at 61 fps to 64 fps and kept frame rates hovering around 62 fps.
The RTX 3080 sits between the RX 6800 XT and the RX 6800, falling slower than RX 6800 XT by 0.3% and faster than RX 6800 by 9.5%. It has an average relative performance against every graphics card here. Its results are actually indistinguishable from those of the RX 6800 XT. Those who have a high refresh rate monitor will enjoy what RTX 3080 has to offer as it averages 273.14053716845 fps. Against its rival - the RX 6800 XT, the RTX 3080 is much slower. In addition, the RTX 3080 was also faster than the RTX 2080 by a good margin. There is a big margin in performance when comparing the RTX 3080 against the RTX 3080 Ti.
The RTX 3080 sits between the RX 6950 XT and the RX 6900 XT, falling slower than RX 6950 XT by 0.2% and faster than RX 6900 XT by 5.7%. It has an average relative performance against every graphics card here. Its results are actually indistinguishable from those of the RX 6950 XT. Those who have a high refresh rate monitor will enjoy what RTX 3080 has to offer as it averages 494.12279465915 fps. In addition, the RTX 3080 was also faster than the RTX 2080 by a good margin. There is a big margin in performance when comparing the RTX 3080 against the RTX 3080 Ti.
The RTX 3080 sits between the RX 6800 XT and the RX 6800, falling slower than RX 6800 XT by 0.3% and faster than RX 6800 by 9.5%. It has an average relative performance against every graphics card here. Its results are actually indistinguishable from those of the RX 6800 XT. Those who have a high refresh rate monitor will enjoy what RTX 3080 has to offer as it averages 273.14053716845 fps. Against its rival - the RX 6800 XT, the RTX 3080 is much slower. In addition, the RTX 3080 was also faster than the RTX 2080 by a good margin. There is a big margin in performance when comparing the RTX 3080 against the RTX 3080 Ti.
The RTX 3080 sits between the RX 6950 XT and the RX 6900 XT, falling slower than RX 6950 XT by 1.1% and faster than RX 6900 XT by 4.9%. It has an average relative performance against every graphics card here. Its results are actually indistinguishable from those of the RX 6950 XT. Those who have a high refresh rate monitor will enjoy what RTX 3080 has to offer as it averages 463.01885730333 fps. In addition, the RTX 3080 was also faster than the RTX 2080 by a good margin. There is a big margin in performance when comparing the RTX 3080 against the RTX 3080 Ti.
The RTX 3080 sits between the RTX 3080 Ti and the RX 6800 XT, falling slower than RTX 3080 Ti by 2.3% and faster than RX 6800 XT by 0%. It has an average relative performance against every graphics card here. Its results are actually indistinguishable from those of the RTX 3080 Ti. Those who have a high refresh rate monitor will enjoy what RTX 3080 has to offer as it averages 541.00292223298 fps. Against its rival - the RX 6800 XT, the RTX 3080 is much slower. In addition, the RTX 3080 was also faster than the RTX 2080 by a good margin. There is a big margin in performance when comparing the RTX 3080 against the RTX 3080 Ti.


What to Consider Before Buying a Graphics Card
If you have been planning to upgrade your system by purchasing a new graphics card. Then there are some important factors to consider.
Resolution VS Quality: Impact on Game Performance
What affects game performance? Clarity or Details?
Ultra VS High Quality Settings in PC Games
Every player has a different notion about the ideal setting for PC games. But in most cases, opting for a High quality graphics configuration is the way to go.
What are CPU or GPU Bottlenecks?
Are you getting sudden frame drops? you might have a bottleneck.
What is the acceptable FPS speed for me?
For some games, you can still enjoy great garphics at lower frame rates.
GPU Hierarchy
GPU Compare
CPU Compare
Gaming Laptops
Gaming Monitors
Gaming Headsets
Discussion and Comments
Share Your Comments