RTX 3050 benchmark with Core i9-10900K 1080p, 1440p, Ultrawide, 4K benchmarks at Low Quality

It is clear that the RTX 3050 is a significantly more capable high-end card that can play AAA titles at 1080p/1440p with 50-60 frames per second. The price/performance ratio is excellent for RTX 3050 against the competition in budget mid-range cards. The RTX 3050 's power requirements are reasonable and it is very efficient compared to the competition. In short the performance is exceptional, there's no question that this is one of the most powerful single GPU out there in 2025 . With current 4096 MB RAM, the RTX 3050 can have very few memory-related bottlenecks in more modern games.

RTX 3050 benchmark with Core i9-10900K 1080p, 1440p, Ultrawide, 4K benchmarks at Low Quality
NVIDIA GeForce RTX 3050
Price $ 200.0
Year 2021
Maximum Recorded Temperature 68C
Max Fan Noise 42dB
Recommended Power Supply 350W
Benchmark CPU Intel Core i9-10900K ($590)
CPU Impact on FPS + 0.0 FPS
CPU Impact on FPS % 0.0%
Benchmark Quality Settings Low Quality Settings
Average 1080p Performance 313.7 FPS
Average 1440p Performance 252.1 FPS
(Ultrawide) Average 1440p Performance 224.8 FPS
Average 4K Performance 172.3 FPS
Memory 4 GB
1080p Cost Per Frame $ 2.2
1440p Cost Per Frame $ 2.9
(Ultrawide) 1440p Cost Per Frame $ 3.4
4K Cost Per Frame $ 4.9
Series RTX 3050
Variant NVIDIA GeForce RTX 3050
Overall Combination Score 99/100 Excellent

The RTX 3060 might be the mid-range flagship of the latest Ampere set of graphics cards, but their prices keep them out of the reach of most entry-level PC gamers. On the other hand, the RTX 3050 is closer to being reasonably affordable at a price tag of $ 200. The good news is, with the release of the RTX 3050 Ti, the RTX 3050 's price is getting more discount.

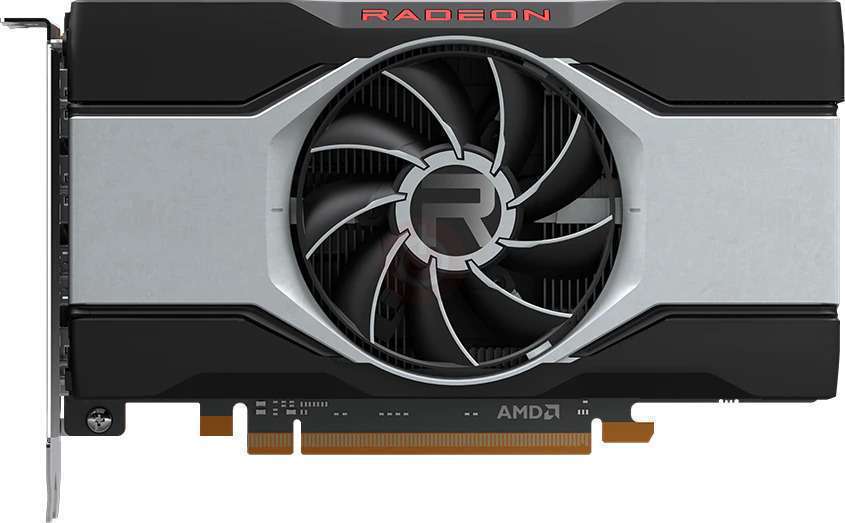
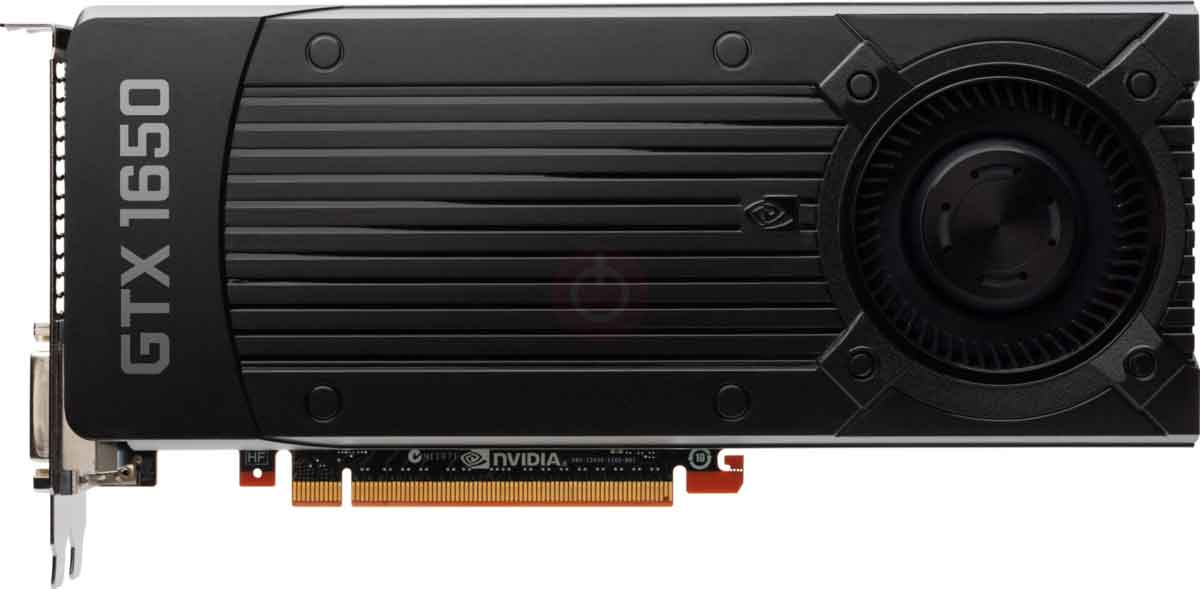
NVIDIA ’s xx50 cards have always been defined by entry-level prices with performance that knocks on the door of mid-range graphics cards – especially when overclocked. After taking the time to fully test the Ampere graphics card inside the RTX 3050, we can say without a doubt that it continues the trend. The RTX 3050 is much more expensive than the GTX 1650 as it costs a whopping $ 200. Compare this to the GTX 1650, which came originally at a price of $ 149. Meanwhile, the AMD closest equivalent card is the RX 5500 XT 4GB which costs $ 169.

Spec for spec, this RTX 3050 leapfrogs its direct predecessor, the GTX 1650, by boasting 63 % more fps. In our synthetic benchmarks, the RTX 3050 blows past the GTX 1650 and, amazingly, even the GTX 1660 as well.

Compared to its AMD 's closest rival, RX 5500 XT 4GB, the RTX 3050 was 40.1 % faster. Fortunately, gaming performance was quite impressive. The RTX 3050 consistently delivers great frame rate increases over the GTX 1650 and it really justifies an upgrade.

For 1080p Full HD, we were able to play Baldur's Gate 3, Armored Core VI, F1 22, Borderlands 3, Anthem at 60 fps to 63 fps and kept frame rates hovering around 61 fps. For 1440p Quad HD, we were able to play World War Z, GreedFall, Hitman 2, Call of Duty: Black Ops 4, Spider-Man Remastered at 63 fps to 68 fps and kept frame rates hovering around 65 fps.

For 2160p 4K, we were able to play Overwatch 2, Valorant at 64 fps to 138 fps and kept frame rates hovering around 101 fps.

Assassin's Creed Valhalla (2020)

Low Quality

Resolution 1920x1080

Year Graphics Card Price Frames Per Second
2021 AMD Radeon RX 6600 XT $ 379
234.4 FPS
2023 NVIDIA GeForce RTX 4050 $ 200
231.6 FPS
2021 NVIDIA GeForce RTX 3060 $ 329
223.1 FPS
2019 AMD Radeon RX 5700 XT $ 399
216.0 FPS
2019 AMD Radeon RX 5700 $ 349
204.0 FPS
2019 NVIDIA GeForce RTX 2060 SUPER $ 400
203.4 FPS
2020 AMD Radeon RX 5600 XT $ 279
192.5 FPS
2019 NVIDIA GeForce RTX 2060 $ 350
191.9 FPS
2021 NVIDIA GeForce RTX 3050 Ti $ 249
187.6 FPS
2019 NVIDIA GeForce GTX 1660 Ti $ 279
183.0 FPS
2021 NVIDIA GeForce RTX 3050 $ 200
181.4 FPS
2019 NVIDIA GeForce GTX 1660 SUPER $ 229
177.7 FPS
2019 NVIDIA GeForce GTX 1660 $ 220
172.9 FPS
2018 AMD Radeon RX 590 $ 279
150.0 FPS
2019 AMD Radeon RX 5500 XT 8GB $ 199
141.8 FPS
2019 AMD Radeon RX 5500 XT 4GB $ 169
135.2 FPS
2019 NVIDIA GeForce GTX 1650 SUPER $ 160
133.8 FPS
2019 NVIDIA GeForce GTX 1650 $ 149
122.0 FPS

The RTX 3050 sits between the GTX 1660 Ti and the GTX 1660 SUPER, falling slower than GTX 1660 Ti by 0.9% and faster than GTX 1660 SUPER by 2.1%. It has an average relative performance against every graphics card here. Its results are actually indistinguishable from those of the GTX 1660 Ti. Those who have a high refresh rate monitor will enjoy what RTX 3050 has to offer as it averages 181.43688838281 fps. The RTX 3050 averaged 181.43688838281 fps in , topping the RX 5500 XT 4GB by a good margin. In addition, the RTX 3050 was also faster than the GTX 1650 by a good margin. Compared to its higher sibling, the RTX 3050 was much slower than the RTX 3060 by more than 20%.

Forza Horizon 4 (2018)

Low Quality

Resolution 1920x1080

Year Graphics Card Price Frames Per Second
2023 NVIDIA GeForce RTX 4050 $ 200
397.3 FPS
2021 NVIDIA GeForce RTX 3060 $ 329
391.1 FPS
2021 AMD Radeon RX 6600 XT $ 379
376.5 FPS
2019 NVIDIA GeForce RTX 2060 SUPER $ 400
376.5 FPS
2019 NVIDIA GeForce RTX 2060 $ 350
355.2 FPS
2019 AMD Radeon RX 5700 XT $ 399
352.1 FPS
2021 NVIDIA GeForce RTX 3050 Ti $ 249
343.9 FPS
2019 AMD Radeon RX 5700 $ 349
332.1 FPS
2019 NVIDIA GeForce GTX 1660 Ti $ 279
329.8 FPS
2020 AMD Radeon RX 5600 XT $ 279
328.0 FPS
2021 NVIDIA GeForce RTX 3050 $ 200
318.6 FPS
2019 NVIDIA GeForce GTX 1660 SUPER $ 229
316.3 FPS
2019 NVIDIA GeForce GTX 1660 $ 220
301.4 FPS
2018 AMD Radeon RX 590 $ 279
270.6 FPS
2019 NVIDIA GeForce GTX 1650 SUPER $ 160
268.0 FPS
2019 AMD Radeon RX 5500 XT 8GB $ 199
255.3 FPS
2019 AMD Radeon RX 5500 XT 4GB $ 169
235.0 FPS
2019 NVIDIA GeForce GTX 1650 $ 149
213.1 FPS

The RTX 3050 sits between the RX 5600 XT and the GTX 1660 SUPER, falling slower than RX 5600 XT by 2.9% and faster than GTX 1660 SUPER by 0.7%. It has an average relative performance against every graphics card here. Its results are actually indistinguishable from those of the RX 5600 XT. Those who have a high refresh rate monitor will enjoy what RTX 3050 has to offer as it averages 318.61844680125 fps. The RTX 3050 averaged 318.61844680125 fps in , topping the RX 5500 XT 4GB by a good margin. In addition, the RTX 3050 was also faster than the GTX 1650 by a good margin. Compared to its higher sibling, the RTX 3050 was much slower than the RTX 3060 by more than 20%.

Cyberpunk 2077 (2020)

Low Quality

Resolution 1920x1080

Year Graphics Card Price Frames Per Second
2021 AMD Radeon RX 6600 XT $ 379
234.4 FPS
2023 NVIDIA GeForce RTX 4050 $ 200
231.6 FPS
2021 NVIDIA GeForce RTX 3060 $ 329
223.1 FPS
2019 AMD Radeon RX 5700 XT $ 399
216.0 FPS
2019 AMD Radeon RX 5700 $ 349
204.0 FPS
2019 NVIDIA GeForce RTX 2060 SUPER $ 400
203.4 FPS
2020 AMD Radeon RX 5600 XT $ 279
192.5 FPS
2019 NVIDIA GeForce RTX 2060 $ 350
191.9 FPS
2021 NVIDIA GeForce RTX 3050 Ti $ 249
187.6 FPS
2019 NVIDIA GeForce GTX 1660 Ti $ 279
183.0 FPS
2021 NVIDIA GeForce RTX 3050 $ 200
181.4 FPS
2019 NVIDIA GeForce GTX 1660 SUPER $ 229
177.7 FPS
2019 NVIDIA GeForce GTX 1660 $ 220
172.9 FPS
2018 AMD Radeon RX 590 $ 279
150.0 FPS
2019 AMD Radeon RX 5500 XT 8GB $ 199
141.8 FPS
2019 AMD Radeon RX 5500 XT 4GB $ 169
135.2 FPS
2019 NVIDIA GeForce GTX 1650 SUPER $ 160
133.8 FPS
2019 NVIDIA GeForce GTX 1650 $ 149
122.0 FPS

The RTX 3050 sits between the GTX 1660 Ti and the GTX 1660 SUPER, falling slower than GTX 1660 Ti by 0.9% and faster than GTX 1660 SUPER by 2.1%. It has an average relative performance against every graphics card here. Its results are actually indistinguishable from those of the GTX 1660 Ti. Those who have a high refresh rate monitor will enjoy what RTX 3050 has to offer as it averages 181.43688838281 fps. The RTX 3050 averaged 181.43688838281 fps in , topping the RX 5500 XT 4GB by a good margin. In addition, the RTX 3050 was also faster than the GTX 1650 by a good margin. Compared to its higher sibling, the RTX 3050 was much slower than the RTX 3060 by more than 20%.

Grand Theft Auto V (2015)

Low Quality

Resolution 1920x1080

Year Graphics Card Price Frames Per Second
2023 NVIDIA GeForce RTX 4050 $ 200
384.9 FPS
2021 NVIDIA GeForce RTX 3060 $ 329
380.8 FPS
2021 AMD Radeon RX 6600 XT $ 379
355.0 FPS
2019 NVIDIA GeForce RTX 2060 SUPER $ 400
352.8 FPS
2019 NVIDIA GeForce RTX 2060 $ 350
346.8 FPS
2021 NVIDIA GeForce RTX 3050 Ti $ 249
334.8 FPS
2019 AMD Radeon RX 5700 XT $ 399
331.9 FPS
2019 NVIDIA GeForce GTX 1660 Ti $ 279
318.9 FPS
2019 AMD Radeon RX 5700 $ 349
312.5 FPS
2021 NVIDIA GeForce RTX 3050 $ 200
309.1 FPS
2020 AMD Radeon RX 5600 XT $ 279
304.3 FPS
2019 NVIDIA GeForce GTX 1660 SUPER $ 229
304.3 FPS
2019 NVIDIA GeForce GTX 1660 $ 220
291.3 FPS
2019 NVIDIA GeForce GTX 1650 SUPER $ 160
251.6 FPS
2018 AMD Radeon RX 590 $ 279
246.5 FPS
2019 AMD Radeon RX 5500 XT 8GB $ 199
231.9 FPS
2019 AMD Radeon RX 5500 XT 4GB $ 169
214.8 FPS
2019 NVIDIA GeForce GTX 1650 $ 149
191.3 FPS

The RTX 3050 sits between the RX 5700 and the RX 5600 XT, falling slower than RX 5700 by 1.1% and faster than RX 5600 XT by 1.6%. It has an average relative performance against every graphics card here. Its results are actually indistinguishable from those of the RX 5700. Those who have a high refresh rate monitor will enjoy what RTX 3050 has to offer as it averages 309.11751529434 fps. The RTX 3050 averaged 309.11751529434 fps in , topping the RX 5500 XT 4GB by a good margin. In addition, the RTX 3050 was also faster than the GTX 1650 by a good margin. Compared to its higher sibling, the RTX 3050 was much slower than the RTX 3060 by more than 20%.

Call of Duty Modern Warfare (2019)

Low Quality

Resolution 1920x1080

Year Graphics Card Price Frames Per Second
2021 AMD Radeon RX 6600 XT $ 379
458.7 FPS
2023 NVIDIA GeForce RTX 4050 $ 200
458.7 FPS
2021 NVIDIA GeForce RTX 3060 $ 329
440.2 FPS
2019 AMD Radeon RX 5700 XT $ 399
430.8 FPS
2019 AMD Radeon RX 5700 $ 349
409.3 FPS
2019 NVIDIA GeForce RTX 2060 SUPER $ 400
408.3 FPS
2020 AMD Radeon RX 5600 XT $ 279
389.1 FPS
2019 NVIDIA GeForce RTX 2060 $ 350
388.0 FPS
2021 NVIDIA GeForce RTX 3050 Ti $ 249
382.8 FPS
2019 NVIDIA GeForce GTX 1660 Ti $ 279
371.5 FPS
2021 NVIDIA GeForce RTX 3050 $ 200
370.2 FPS
2019 NVIDIA GeForce GTX 1660 SUPER $ 229
361.6 FPS
2019 NVIDIA GeForce GTX 1660 $ 220
352.8 FPS
2019 NVIDIA GeForce GTX 1650 SUPER $ 160
317.4 FPS
2018 AMD Radeon RX 590 $ 279
310.3 FPS
2019 AMD Radeon RX 5500 XT 8GB $ 199
288.1 FPS
2019 AMD Radeon RX 5500 XT 4GB $ 169
265.1 FPS
2019 NVIDIA GeForce GTX 1650 $ 149
256.1 FPS

The RTX 3050 sits between the GTX 1660 Ti and the GTX 1660 SUPER, falling slower than GTX 1660 Ti by 0.3% and faster than GTX 1660 SUPER by 2.4%. It has an average relative performance against every graphics card here. Its results are actually indistinguishable from those of the GTX 1660 Ti. Those who have a high refresh rate monitor will enjoy what RTX 3050 has to offer as it averages 370.17433723294 fps. The RTX 3050 averaged 370.17433723294 fps in , topping the RX 5500 XT 4GB by a good margin. In addition, the RTX 3050 was also faster than the GTX 1650 by a good margin.

Game Performance at Low Quality settings

Change Quality Settings

Resolution 1920x1080

1% Low [Min FPS] Average FPS
Year Game Frames Per Second
2023 Resident Evil 4
240
267.5
2023 A Plague Tale: Requiem
181
201.6
2023 Hogwarts Legacy
163
181.1
2023 The Last of Us Part I
133
148.3
2023 Forspoken
149
166.2
2023 The Callisto Protocol
122
136.6
2023 Dead Space
181
201.6
2023 Baldur's Gate 3
206
229.1
2023 Armored Core VI
206
229.1
2023 Immortals of Aveum
112
124.5
2023 Ratchet and Clank Rift Apart
190
211.6
2023 Remnant II
122
136.6
2023 Star Wars Jedi: Survivor
153
170.4
2023 Atomic Heart
153
170.4
2023 Starfield
89
99.4
2022 Elden Ring
195
216.8
2022 God of War
187
208.4
2022 Overwatch 2
293
326.3
2022 F1 22
207
231.1
2022 Dying Light 2
199
221.4
2022 Total War: Warhammer III
199
221.4
2022 Spider-Man Remastered
285
317.4
2022 Call of Duty: Modern Warfare II
224
249.5
2021 Forza Horizon 5
189
210.2
2021 Halo Infinite
154
171.3
2021 Battlefield 2042
243
270.0
2021 Hitman 3
248
276.0
2021 Far Cry 6
235
262.0
2021 Guardians of the Galaxy
251
279.5
2020 Watch Dogs: Legion
253
281.3
2020 Assassin's Creed Valhalla
163
181.4
2020 Microsoft Flight Simulator
118
131.7
2020 Valorant
459
510.5
2020 Call of Duty: Black Ops Cold War
244
271.9
2020 Death Stranding
271
301.9
2020 Marvel's Avengers
198
220.3
2020 Godfall
265
294.5
2020 Cyberpunk 2077
163
181.4
2019 Apex Legends
293
325.6
2019 Anthem
213
237.2
2019 Far Cry New Dawn
282
313.9
2019 Resident Evil 2
323
359.4
2019 Metro Exodus
182
202.8
2019 World War Z
269
299.4
2019 Gears of War 5
246
274.4
2019 F1 2019
290
323.3
2019 GreedFall
269
299.4
2019 Borderlands 3
208
231.6
2019 Call of Duty Modern Warfare
333
370.2
2019 Red Dead Redemption 2
166
184.5
2019 Need For Speed: Heat
232
258.8
2018 Call of Duty: Black Ops 4
327
363.7
2018 Assassin's Creed Odyssey
174
193.8
2018 Final Fantasy XV
256
284.6
2018 Shadow of the Tomb Raider
244
271.9
2018 Forza Horizon 4
286
318.6
2018 Fallout 76
350
389.1
2018 Hitman 2
295
328.0
2018 Just Cause 4
237
264.1
2018 Monster Hunter: World
249
277.0
2018 Strange Brigade
344
382.8
2018 Battlefield V
299
332.6
2017 Dawn of War III
288
321.0
2017 Ghost Recon Wildlands
244
271.9
2017 Assassin's Creed Origins
230
256.1
2017 Destiny 2
362
403.3
2017 PlayerUnknown's Battlegrounds
246
274.4
2017 Fortnite Battle Royale
286
318.6
2017 Need For Speed: Payback
299
332.6
2017 For Honor
362
403.3
2017 Project CARS 2
286
318.6
2017 Forza Motorsport 7
329
365.9
2016 Deus Ex: Mankind Divided
210
234.4
2016 Ashes of the Singularity: Escalation
251
279.5
2016 Doom
397
442.1
2016 F1 2016
290
323.3
2016 Total War: Warhammer
284
316.3
2016 Battlefield 1
333
370.2
2016 Overwatch
387
430.8
2016 Dishonored 2
228
253.5
2015 Grand Theft Auto V
278
309.1
2015 Rocket League
683
759.1
2015 Need For Speed
315
350.6
2015 Project CARS
307
341.6
2015 Rainbow Six Siege
469
521.9
2012 Counter-Strike: Global Offensive
559
622.2
2009 League of Legends
764
849.3

Resolution 2560x1440

1% Low [Min FPS] Average FPS
Year Game Frames Per Second
2023 Resident Evil 4
169
211.6
2023 A Plague Tale: Requiem
127
159.3
2023 Hogwarts Legacy
118
148.3
2023 The Last of Us Part I
95
119.8
2023 Forspoken
95
119.8
2023 The Callisto Protocol
83
104.4
2023 Dead Space
118
148.3
2023 Baldur's Gate 3
156
195.6
2023 Armored Core VI
156
195.6
2023 Immortals of Aveum
75
93.9
2023 Ratchet and Clank Rift Apart
127
159.3
2023 Remnant II
79
99.4
2023 Star Wars Jedi: Survivor
109
136.6
2023 Atomic Heart
105
131.7
2023 Starfield
72
91.1
2022 Elden Ring
145
181.4
2022 God of War
148
185.8
2022 Overwatch 2
234
293.3
2022 F1 22
127
159.3
2022 Dying Light 2
127
159.3
2022 Total War: Warhammer III
136
170.4
2022 Spider-Man Remastered
199
249.5
2022 Call of Duty: Modern Warfare II
144
181.1
2021 Forza Horizon 5
150
187.6
2021 Halo Infinite
126
158.3
2021 Battlefield 2042
159
199.8
2021 Hitman 3
172
215.7
2021 Far Cry 6
169
211.6
2021 Guardians of the Galaxy
173
217.4
2020 Watch Dogs: Legion
164
205.7
2020 Assassin's Creed Valhalla
129
162.3
2020 Microsoft Flight Simulator
93
117.2
2020 Valorant
359
449.5
2020 Call of Duty: Black Ops Cold War
180
226.0
2020 Death Stranding
200
250.8
2020 Marvel's Avengers
137
172.0
2020 Godfall
176
220.3
2020 Cyberpunk 2077
137
172.0
2019 Apex Legends
211
264.1
2019 Anthem
159
199.8
2019 Far Cry New Dawn
209
261.4
2019 Resident Evil 2
217
271.9
2019 Metro Exodus
132
165.5
2019 World War Z
189
237.2
2019 Gears of War 5
173
217.4
2019 F1 2019
200
250.8
2019 GreedFall
189
237.2
2019 Borderlands 3
142
178.3
2019 Call of Duty Modern Warfare
235
294.5
2019 Red Dead Redemption 2
127
159.0
2019 Need For Speed: Heat
173
217.4
2018 Call of Duty: Black Ops 4
198
248.1
2018 Assassin's Creed Odyssey
129
162.3
2018 Final Fantasy XV
173
217.4
2018 Shadow of the Tomb Raider
162
202.8
2018 Forza Horizon 4
227
284.6
2018 Fallout 76
233
292.1
2018 Hitman 2
191
239.9
2018 Just Cause 4
169
211.6
2018 Monster Hunter: World
171
214.5
2018 Strange Brigade
239
299.4
2018 Battlefield V
227
284.6
2017 Dawn of War III
209
261.4
2017 Ghost Recon Wildlands
176
220.3
2017 Assassin's Creed Origins
171
214.5
2017 Destiny 2
290
363.7
2017 PlayerUnknown's Battlegrounds
180
226.0
2017 Fortnite Battle Royale
187
234.4
2017 Need For Speed: Payback
211
264.1
2017 For Honor
221
277.0
2017 Project CARS 2
198
248.1
2017 Forza Motorsport 7
273
341.6
2016 Deus Ex: Mankind Divided
142
178.3
2016 Ashes of the Singularity: Escalation
196
245.4
2016 Doom
280
350.6
2016 F1 2016
221
277.0
2016 Total War: Warhammer
204
256.1
2016 Battlefield 1
241
301.9
2016 Overwatch
267
334.8
2016 Dishonored 2
183
228.8
2015 Grand Theft Auto V
191
239.9
2015 Rocket League
374
467.7
2015 Need For Speed
233
292.1
2015 Project CARS
223
279.5
2015 Rainbow Six Siege
314
393.2
2012 Counter-Strike: Global Offensive
447
559.1
2009 League of Legends
509
636.4

Resolution 3440x1440

1% Low [Min FPS] Average FPS
Year Game Frames Per Second
2019 Apex Legends
178
234.4
2019 Anthem
130
172.0
2019 Far Cry New Dawn
171
226.0
2019 Resident Evil 2
176
231.6
2019 Metro Exodus
113
149.0
2019 World War Z
160
211.6
2019 Gears of War 5
149
196.8
2019 F1 2019
173
228.8
2019 GreedFall
144
190.7
2019 Borderlands 3
115
152.3
2019 Call of Duty Modern Warfare
198
261.4
2019 Red Dead Redemption 2
108
142.1
2019 Need For Speed: Heat
149
196.8
2018 Call of Duty: Black Ops 4
156
205.7
2018 Assassin's Creed Odyssey
115
152.3
2018 Final Fantasy XV
144
190.7
2018 Shadow of the Tomb Raider
130
172.0
2018 Forza Horizon 4
196
258.8
2018 Fallout 76
194
256.1
2018 Hitman 2
163
214.5
2018 Just Cause 4
137
181.4
2018 Monster Hunter: World
135
178.3
2018 Strange Brigade
198
261.4
2018 Battlefield V
186
245.4
2017 Dawn of War III
171
226.0
2017 Ghost Recon Wildlands
147
193.8
2017 Assassin's Creed Origins
147
193.8
2017 Destiny 2
238
313.9
2017 PlayerUnknown's Battlegrounds
151
199.8
2017 Fortnite Battle Royale
154
202.8
2017 Need For Speed: Payback
186
245.4
2017 For Honor
180
237.2
2017 Project CARS 2
186
245.4
2017 Forza Motorsport 7
256
337.1
2016 Deus Ex: Mankind Divided
118
155.7
2016 Ashes of the Singularity: Escalation
180
237.2
2016 Doom
231
304.3
2016 F1 2016
192
253.5
2016 Total War: Warhammer
171
226.0
2016 Battlefield 1
200
264.1
2016 Overwatch
220
289.6
2016 Dishonored 2
167
220.3
2015 Grand Theft Auto V
154
202.8
2015 Rocket League
303
399.3
2015 Need For Speed
204
269.3
2015 Project CARS
198
261.4
2015 Rainbow Six Siege
252
332.6
2012 Counter-Strike: Global Offensive
429
565.1
2009 League of Legends
408
537.7

Resolution 3840x2160

1% Low [Min FPS] Average FPS
Year Game Frames Per Second
2023 Resident Evil 4
119
170.4
2023 A Plague Tale: Requiem
78
112.0
2023 Hogwarts Legacy
78
112.0
2023 The Last of Us Part I
50
71.6
2023 Forspoken
46
66.0
2023 The Callisto Protocol
41
59.7
2023 Dead Space
50
71.6
2023 Baldur's Gate 3
87
124.5
2023 Armored Core VI
87
124.5
2023 Immortals of Aveum
35
50.5
2023 Ratchet and Clank Rift Apart
69
99.4
2023 Remnant II
39
56.5
2023 Star Wars Jedi: Survivor
54
77.6
2023 Atomic Heart
63
91.1
2023 Starfield
46
66.0
2022 Elden Ring
82
117.6
2022 God of War
107
153.3
2022 Overwatch 2
167
239.4
2022 F1 22
87
124.5
2022 Dying Light 2
87
124.5
2022 Total War: Warhammer III
95
136.6
2022 Spider-Man Remastered
134
191.6
2022 Call of Duty: Modern Warfare II
87
124.5
2021 Forza Horizon 5
108
154.7
2021 Halo Infinite
82
118.3
2021 Battlefield 2042
99
142.8
2021 Hitman 3
103
148.3
2021 Far Cry 6
92
131.7
2021 Guardians of the Galaxy
95
136.6
2020 Watch Dogs: Legion
103
148.3
2020 Assassin's Creed Valhalla
84
120.9
2020 Microsoft Flight Simulator
68
98.2
2020 Valorant
287
411.3
2020 Call of Duty: Black Ops Cold War
99
142.1
2020 Death Stranding
120
172.0
2020 Marvel's Avengers
71
102.1
2020 Godfall
87
124.5
2020 Cyberpunk 2077
87
124.5
2019 Apex Legends
127
181.4
2019 Anthem
87
124.5
2019 Far Cry New Dawn
113
162.3
2019 Resident Evil 2
113
162.3
2019 Metro Exodus
82
117.2
2019 World War Z
111
159.0
2019 Gears of War 5
106
152.3
2019 F1 2019
124
178.3
2019 GreedFall
84
120.9
2019 Borderlands 3
76
109.8
2019 Call of Duty Modern Warfare
141
202.8
2019 Red Dead Redemption 2
79
113.5
2019 Need For Speed: Heat
106
152.3
2018 Call of Duty: Black Ops 4
94
135.2
2018 Assassin's Creed Odyssey
87
124.5
2018 Final Fantasy XV
101
145.6
2018 Shadow of the Tomb Raider
84
120.9
2018 Forza Horizon 4
146
208.7
2018 Fallout 76
133
190.7
2018 Hitman 2
113
162.3
2018 Just Cause 4
89
128.1
2018 Monster Hunter: World
84
120.9
2018 Strange Brigade
133
190.7
2018 Battlefield V
127
181.4
2017 Dawn of War III
115
165.5
2017 Ghost Recon Wildlands
101
145.6
2017 Assassin's Creed Origins
106
152.3
2017 Destiny 2
156
223.1
2017 PlayerUnknown's Battlegrounds
104
149.0
2017 Fortnite Battle Royale
104
149.0
2017 Need For Speed: Payback
141
202.8
2017 For Honor
115
165.5
2017 Project CARS 2
152
217.4
2017 Forza Motorsport 7
209
299.4
2016 Deus Ex: Mankind Divided
76
109.8
2016 Ashes of the Singularity: Escalation
144
205.7
2016 Doom
156
223.1
2016 F1 2016
141
202.8
2016 Total War: Warhammer
118
168.8
2016 Battlefield 1
137
196.8
2016 Overwatch
146
208.7
2016 Dishonored 2
133
190.7
2015 Grand Theft Auto V
97
138.7
2015 Rocket League
193
277.0
2015 Need For Speed
152
217.4
2015 Project CARS
152
217.4
2015 Rainbow Six Siege
160
228.8
2012 Counter-Strike: Global Offensive
366
523.5
2009 League of Legends
250
357.2
RTX 3050 with Core i9-10900K at 1080p and Low Quality settings
RTX 3050 with Core i9-10900K at 1440p and Low Quality settings
RTX 3050 with Core i9-10900K at 4K and Low Quality settings

RTX 3050 Specifications

RTX 3050 Board Design

Length242 mm 9.5 inches
Outputs1x HDMI 3x DisplayPort
Power Connectors1x 12-pin
Slot WidthDual-slot
TDP90 W

RTX 3050 Clock Speeds

Boost Clock1740 MHz
GPU Clock1545 MHz
Memory Clock1750 MHz 14 Gbps effective

RTX 3050 Graphics Card

Bus InterfacePCIe 4.0 x16
GenerationGeForce 30
Launch Price200 USD
ProductionActive
Release Date2021

RTX 3050 Graphics Features

CUDA8.6
DirectX12 Ultimate (12_2)
OpenCL2.0
OpenGL4.6
Shader Model6.5
Vulkan1.2.140

RTX 3050 Graphics Processor

ArchitectureAmpere
Die Sizeunknown
GPU NameGA107
GPU VariantGA107-300-A1
Process Size8 nm
Transistorsunknown

RTX 3050 Memory

Bandwidth224.0 GB/s
Memory Bus128 bit
Memory Size4096 MB
Memory TypeGDDR6

RTX 3050 Render Config

ROPs40
RT Cores18
SM Count18
Shading Units2304
TMUs72
Tensor Cores72

RTX 3050 Theoretical Performance

FP16 (half) performance8.018 TFLOPS (1:1)
FP32 (float) performance8.018 TFLOPS
FP64 (double) performance125.3 GFLOPS (1:64)
Pixel Rate69.60 GPixel/s
Texture Rate125.3 GTexel/s

Critics Reviews


Discussion and Comments

Share Your Comments