GTX 1080 con i7-6700K benchmarks en Ultra calidad ajustes de calidad

En términos de memoria, el GTX 1080 8192 MB RAM es más que suficiente para los juegos modernos y no debe causar ningún cuello de botella. En Resumen, el rendimiento es excepcional, no hay duda de que este es uno de los más potentes GPU único que 2025 hay en.

 GTX 1080 con i7-6700K benchmarks en Ultra calidad ajustes de calidad
NVIDIA GeForce GTX 1080
Precio € 459.4
Yera 2016
Temperatura máxima registrada 83C
Ruido máximo del ventilador 51.6dB
Fuente de alimentación recomendada 530W
CPU de Benchmark Intel Core i7-6700K @ 4.00GHz ($334.99)
Impacto de CPU en FPS + 0.0 FPS
Impacto de CPU en FPS% 0.0%
Parámetros de calidad de Benchmark Ultra Quality Settings
Rendimiento medio de 1080p 109.6 FPS
Rendimiento 1440p promedio 80.8 FPS
(Ultrawide) Rendimiento 1440p promedio 69.0 FPS
Rendimiento promedio de 4K 48.2 FPS
Memoria 8 GB
1080p costo por cuadro € 4.0
1440p costo por cuadro € 5.4
(Ultrawide) 1440p costo por cuadro € 6.4
Costo 4K por cuadro € 9.1
Serie GTX 1080
Variant NVIDIA GeForce GTX 1080
Puntuación de combinación total 80/100 Excelente

La buena noticia es que, con el lanzamiento de GTX 1080 Ti, el precio del GTX 1080 está obteniendo más descuento. NVIDIA tarjetas xx80 siempre se han definido por los precios high-end con un rendimiento que llama a la puerta de las tarjetas gráficas extreme, especialmente cuando se hace overclock. Después de tomarse el tiempo para probar completamente la tarjeta gráfica Pascal dentro del GTX 1080, podemos decir sin lugar a dudas que continúa la tendencia.

Especificación por especificación, este GTX 1080 salta a su predecesor directo, el GTX 980, al jactarse 48.7 % más fps. El GTX 1080 tiene 8 GB de RAM en comparación con la GTX 980 memoria de video de 4 GB.

En comparación con el rival más cercano de AMD, RX Vega 64, el GTX 1080 fue 7.2 % más rápido. Afortunadamente, el rendimiento de los juegos fue bastante impresionante. El GTX 1080 consistentemente ofrece grandes aumentos en la velocidad de cuadros sobre el GTX 980, NVIDIA GeForce GTX 980 Ti y realmente justifica una actualización.

Para 1080p Full HD, pudimos jugar Forza Horizon 5, Elden Ring, Marvel's Avengers, Ratchet and Clank Rift Apart, Dying Light 2 en 61 fps a 68 fps y mantuvieron las velocidades de cuadro rondando 64 fps. Para 1440p Quad HD, pudimos jugar Watch Dogs: Legion, Gears of War 5, Need For Speed: Heat, Shadow of the Tomb Raider, Just Cause 4 en 61 fps a 63 fps y mantuvieron las velocidades de cuadro rondando 62 fps.

Para 2160p 4K, pudimos jugar Forza Horizon 4, Overwatch 2, Valorant en 65 fps a 153 fps y mantuvieron las velocidades de cuadro rondando 97 fps.

Assassin's Creed Valhalla (2020)

Ultra calidad

Resolución 1920x1080

Yera Tarjeta gráfica Precio FotoGramas por segundo
2019 NVIDIA GeForce RTX 2080 SUPER € 615
69.0 FPS
2018 NVIDIA GeForce RTX 2080 € 615
63.9 FPS
2019 NVIDIA GeForce RTX 2070 SUPER € 439
60.0 FPS
2017 NVIDIA GeForce GTX 1080 Ti € 668
58.6 FPS
2019 AMD Radeon VII € 615
56.3 FPS
2018 NVIDIA GeForce RTX 2070 € 439
56.0 FPS
2019 AMD Radeon RX 5700 XT € 351
55.5 FPS
2019 AMD Radeon RX 5700 € 307
51.4 FPS
2019 NVIDIA GeForce RTX 2060 SUPER € 352
51.2 FPS
2016 NVIDIA GeForce GTX 1080 € 439
48.9 FPS
2019 NVIDIA GeForce RTX 2060 € 308
47.4 FPS
2017 AMD Radeon RX Vega 64 € 439
46.7 FPS
2017 NVIDIA GeForce GTX 1070 Ti € 360
46.3 FPS
2017 AMD Radeon RX Vega 56 € 351
45.2 FPS
2015 NVIDIA GeForce GTX TITAN X € 879
45.0 FPS
2019 NVIDIA GeForce GTX 1660 Ti € 246
44.5 FPS
2016 NVIDIA GeForce GTX 1070 € 351
43.0 FPS
2019 NVIDIA GeForce GTX 1660 SUPER € 202
42.8 FPS
2019 NVIDIA GeForce GTX 1660 € 194
41.3 FPS
2015 NVIDIA GeForce GTX 980 Ti € 571
35.2 FPS
2015 AMD Radeon R9 FURY X € 571
34.6 FPS
2018 AMD Radeon RX 590 € 246
34.3 FPS
2015 AMD Radeon R9 Nano € 571
32.6 FPS
2019 AMD Radeon RX 5500 XT 8GB € 175
31.9 FPS
2014 NVIDIA GeForce GTX 980 € 483
31.9 FPS
2015 AMD Radeon R9 FURY € 483
30.9 FPS
2019 AMD Radeon RX 5500 XT 4GB € 149
30.0 FPS
2017 AMD Radeon RX 580 € 202
29.9 FPS
2019 NVIDIA GeForce GTX 1650 SUPER € 141
29.6 FPS
2016 NVIDIA GeForce GTX 1060 6GB € 224
29.3 FPS
2014 NVIDIA GeForce GTX TITAN BLACK € 879
29.1 FPS
2016 AMD Radeon RX 480 € 352
28.1 FPS
2016 NVIDIA GeForce GTX 1060 3GB € 150
28.1 FPS
2013 AMD Radeon HD 7990 € 879
28.0 FPS
2015 AMD Radeon R9 390X € 378
27.9 FPS
2013 NVIDIA GeForce GTX 780 Ti € 615
27.5 FPS
2017 AMD Radeon RX 570 € 149
27.4 FPS
2013 NVIDIA GeForce GTX TITAN € 879
27.1 FPS
2014 NVIDIA GeForce GTX 970 € 290
26.8 FPS
2013 AMD Radeon R9 290X € 483
26.4 FPS
2015 AMD Radeon R9 390 € 290
26.3 FPS
2019 NVIDIA GeForce GTX 1650 € 131
26.3 FPS
2013 AMD Radeon R9 290 € 351
24.6 FPS
2013 NVIDIA GeForce GTX 780 € 571
22.1 FPS

El GTX 1080 encuentra entre el RTX 2060 SUPER y el RTX 2060 , cayendo más lento que RTX 2060 SUPER en 4.7 % y más rápido que RTX 2060 en 3.2 %. Tiene un rendimiento relativo fuerte contra todas las tarjetas gráficas aquí. Es una llamada cercana entre la GTX 1080 y su rival RX Vega 64 por un pequeño margen. Además, la GTX 1080 también fue más rápida que la GTX 980 por un buen margen.

Forza Horizon 4 (2018)

Ultra calidad

Resolución 1920x1080

Yera Tarjeta gráfica Precio FotoGramas por segundo
2019 NVIDIA GeForce RTX 2080 SUPER € 615
144.0 FPS
2018 NVIDIA GeForce RTX 2080 € 615
139.0 FPS
2017 NVIDIA GeForce GTX 1080 Ti € 668
135.0 FPS
2019 NVIDIA GeForce RTX 2070 SUPER € 439
132.0 FPS
2018 NVIDIA GeForce RTX 2070 € 439
125.0 FPS
2019 NVIDIA GeForce RTX 2060 SUPER € 352
121.0 FPS
2016 NVIDIA GeForce GTX 1080 € 439
117.0 FPS
2019 AMD Radeon VII € 615
113.7 FPS
2019 NVIDIA GeForce RTX 2060 € 308
111.1 FPS
2019 AMD Radeon RX 5700 XT € 351
109.7 FPS
2017 NVIDIA GeForce GTX 1070 Ti € 360
105.0 FPS
2019 AMD Radeon RX 5700 € 307
100.8 FPS
2015 NVIDIA GeForce GTX TITAN X € 879
100.0 FPS
2019 NVIDIA GeForce GTX 1660 Ti € 246
99.8 FPS
2016 NVIDIA GeForce GTX 1070 € 351
96.0 FPS
2019 NVIDIA GeForce GTX 1660 SUPER € 202
94.0 FPS
2015 NVIDIA GeForce GTX 980 Ti € 571
94.0 FPS
2017 AMD Radeon RX Vega 64 € 439
91.0 FPS
2017 AMD Radeon RX Vega 56 € 351
89.0 FPS
2019 NVIDIA GeForce GTX 1660 € 194
87.8 FPS
2018 AMD Radeon RX 590 € 246
75.5 FPS
2019 NVIDIA GeForce GTX 1650 SUPER € 141
74.5 FPS
2014 NVIDIA GeForce GTX 980 € 483
73.0 FPS
2016 NVIDIA GeForce GTX 1060 6GB € 224
70.2 FPS
2019 AMD Radeon RX 5500 XT 8GB € 175
69.7 FPS
2017 AMD Radeon RX 580 € 202
68.2 FPS
2015 AMD Radeon R9 FURY X € 571
68.0 FPS
2016 NVIDIA GeForce GTX 1060 3GB € 150
66.6 FPS
2014 NVIDIA GeForce GTX 970 € 290
63.4 FPS
2015 AMD Radeon R9 Nano € 571
63.0 FPS
2019 AMD Radeon RX 5500 XT 4GB € 149
62.2 FPS
2015 AMD Radeon R9 390X € 378
57.0 FPS
2019 NVIDIA GeForce GTX 1650 € 131
54.5 FPS
2013 NVIDIA GeForce GTX TITAN € 879
54.0 FPS
2013 AMD Radeon R9 290 € 351
53.0 FPS
2015 AMD Radeon R9 390 € 290
52.0 FPS
2017 AMD Radeon RX 570 € 149
52.0 FPS
2013 NVIDIA GeForce GTX 780 Ti € 615
42.6 FPS
2013 NVIDIA GeForce GTX 780 € 571
41.0 FPS
2013 AMD Radeon R9 290X € 483
37.0 FPS

El GTX 1080 encuentra entre el RTX 2060 SUPER y el Radeon VII , cayendo más lento que RTX 2060 SUPER en 3.4 % y más rápido que Radeon VII en 2.9 %. Tiene un rendimiento relativo fuerte contra todas las tarjetas gráficas aquí. El GTX 1080 promedió 117 fps en , superando al RX Vega 64 por un buen margen. Además, la GTX 1080 también fue más rápida que la GTX 980 por un buen margen. En comparación con su hermano menor, el GTX 1070 , vemos un rendimiento más del 20% más rápido para el GTX 1080 .

Cyberpunk 2077 (2020)

Ultra calidad

Resolución 1920x1080

Yera Tarjeta gráfica Precio FotoGramas por segundo
2019 NVIDIA GeForce RTX 2080 SUPER € 615
69.0 FPS
2018 NVIDIA GeForce RTX 2080 € 615
63.9 FPS
2019 NVIDIA GeForce RTX 2070 SUPER € 439
60.0 FPS
2017 NVIDIA GeForce GTX 1080 Ti € 668
58.6 FPS
2019 AMD Radeon VII € 615
56.3 FPS
2018 NVIDIA GeForce RTX 2070 € 439
56.0 FPS
2019 AMD Radeon RX 5700 XT € 351
55.5 FPS
2019 AMD Radeon RX 5700 € 307
51.4 FPS
2019 NVIDIA GeForce RTX 2060 SUPER € 352
51.2 FPS
2016 NVIDIA GeForce GTX 1080 € 439
48.9 FPS
2019 NVIDIA GeForce RTX 2060 € 308
47.4 FPS
2017 AMD Radeon RX Vega 64 € 439
46.7 FPS
2017 NVIDIA GeForce GTX 1070 Ti € 360
46.3 FPS
2017 AMD Radeon RX Vega 56 € 351
45.2 FPS
2015 NVIDIA GeForce GTX TITAN X € 879
45.0 FPS
2019 NVIDIA GeForce GTX 1660 Ti € 246
44.5 FPS
2016 NVIDIA GeForce GTX 1070 € 351
43.0 FPS
2019 NVIDIA GeForce GTX 1660 SUPER € 202
42.8 FPS
2019 NVIDIA GeForce GTX 1660 € 194
41.3 FPS
2015 NVIDIA GeForce GTX 980 Ti € 571
35.2 FPS
2015 AMD Radeon R9 FURY X € 571
34.6 FPS
2018 AMD Radeon RX 590 € 246
34.3 FPS
2015 AMD Radeon R9 Nano € 571
32.6 FPS
2019 AMD Radeon RX 5500 XT 8GB € 175
31.9 FPS
2014 NVIDIA GeForce GTX 980 € 483
31.9 FPS
2015 AMD Radeon R9 FURY € 483
30.9 FPS
2019 AMD Radeon RX 5500 XT 4GB € 149
30.0 FPS
2017 AMD Radeon RX 580 € 202
29.9 FPS
2019 NVIDIA GeForce GTX 1650 SUPER € 141
29.6 FPS
2016 NVIDIA GeForce GTX 1060 6GB € 224
29.3 FPS
2014 NVIDIA GeForce GTX TITAN BLACK € 879
29.1 FPS
2016 AMD Radeon RX 480 € 352
28.1 FPS
2016 NVIDIA GeForce GTX 1060 3GB € 150
28.1 FPS
2013 AMD Radeon HD 7990 € 879
28.0 FPS
2015 AMD Radeon R9 390X € 378
27.9 FPS
2013 NVIDIA GeForce GTX 780 Ti € 615
27.5 FPS
2017 AMD Radeon RX 570 € 149
27.4 FPS
2013 NVIDIA GeForce GTX TITAN € 879
27.1 FPS
2014 NVIDIA GeForce GTX 970 € 290
26.8 FPS
2013 AMD Radeon R9 290X € 483
26.4 FPS
2015 AMD Radeon R9 390 € 290
26.3 FPS
2019 NVIDIA GeForce GTX 1650 € 131
26.3 FPS
2013 AMD Radeon R9 290 € 351
24.6 FPS
2013 NVIDIA GeForce GTX 780 € 571
22.1 FPS

El GTX 1080 encuentra entre el RTX 2060 SUPER y el RTX 2060 , cayendo más lento que RTX 2060 SUPER en 4.7 % y más rápido que RTX 2060 en 3.2 %. Tiene un rendimiento relativo fuerte contra todas las tarjetas gráficas aquí. Es una llamada cercana entre la GTX 1080 y su rival RX Vega 64 por un pequeño margen. Además, la GTX 1080 también fue más rápida que la GTX 980 por un buen margen.

Grand Theft Auto V (2015)

Ultra calidad

Resolución 1920x1080

Yera Tarjeta gráfica Precio FotoGramas por segundo
2019 NVIDIA GeForce RTX 2080 SUPER € 615
137.0 FPS
2018 NVIDIA GeForce RTX 2080 € 615
132.6 FPS
2017 NVIDIA GeForce GTX 1080 Ti € 668
129.1 FPS
2019 NVIDIA GeForce RTX 2070 SUPER € 439
126.0 FPS
2018 NVIDIA GeForce RTX 2070 € 439
120.0 FPS
2016 NVIDIA GeForce GTX 1080 € 439
111.4 FPS
2019 NVIDIA GeForce RTX 2060 SUPER € 352
110.0 FPS
2019 NVIDIA GeForce RTX 2060 € 308
107.3 FPS
2019 AMD Radeon VII € 615
104.6 FPS
2019 AMD Radeon RX 5700 XT € 351
100.7 FPS
2017 NVIDIA GeForce GTX 1070 Ti € 360
100.1 FPS
2019 NVIDIA GeForce GTX 1660 Ti € 246
95.1 FPS
2016 NVIDIA GeForce GTX 1070 € 351
92.7 FPS
2019 AMD Radeon RX 5700 € 307
92.4 FPS
2019 NVIDIA GeForce GTX 1660 SUPER € 202
89.0 FPS
2017 AMD Radeon RX Vega 64 € 439
83.7 FPS
2019 NVIDIA GeForce GTX 1660 € 194
83.7 FPS
2017 AMD Radeon RX Vega 56 € 351
83.6 FPS
2015 NVIDIA GeForce GTX TITAN X € 879
82.4 FPS
2015 NVIDIA GeForce GTX 980 Ti € 571
80.0 FPS
2015 AMD Radeon R9 FURY X € 571
70.0 FPS
2019 NVIDIA GeForce GTX 1650 SUPER € 141
68.3 FPS
2018 AMD Radeon RX 590 € 246
66.4 FPS
2014 NVIDIA GeForce GTX 980 € 483
65.7 FPS
2015 AMD Radeon R9 Nano € 571
62.1 FPS
2016 NVIDIA GeForce GTX 1060 6GB € 224
61.4 FPS
2019 AMD Radeon RX 5500 XT 8GB € 175
61.1 FPS
2017 AMD Radeon RX 580 € 202
60.0 FPS
2016 NVIDIA GeForce GTX 1060 3GB € 150
58.3 FPS
2015 AMD Radeon R9 390X € 378
58.1 FPS
2014 NVIDIA GeForce GTX 970 € 290
56.2 FPS
2015 AMD Radeon R9 390 € 290
55.5 FPS
2019 AMD Radeon RX 5500 XT 4GB € 149
55.1 FPS
2013 NVIDIA GeForce GTX TITAN € 879
51.7 FPS
2013 NVIDIA GeForce GTX 780 € 571
51.0 FPS
2013 AMD Radeon R9 290 € 351
50.7 FPS
2017 AMD Radeon RX 570 € 149
50.3 FPS
2013 AMD Radeon R9 290X € 483
47.7 FPS
2019 NVIDIA GeForce GTX 1650 € 131
47.2 FPS
2013 NVIDIA GeForce GTX 780 Ti € 615
44.1 FPS

El GTX 1080 encuentra entre el RTX 2070 y el RTX 2060 SUPER , cayendo más lento que RTX 2070 en 7.7 % y más rápido que RTX 2060 SUPER en 1.3 %. Tiene un rendimiento relativo fuerte contra todas las tarjetas gráficas aquí. El GTX 1080 promedió 111.4 fps en , superando al RX Vega 64 por un buen margen. Además, la GTX 1080 también fue más rápida que la GTX 980 por un buen margen.

Call of Duty Modern Warfare (2019)

Ultra calidad

Resolución 1920x1080

Yera Tarjeta gráfica Precio FotoGramas por segundo
2019 NVIDIA GeForce RTX 2080 SUPER € 615
184.0 FPS
2018 NVIDIA GeForce RTX 2080 € 615
170.4 FPS
2019 NVIDIA GeForce RTX 2070 SUPER € 439
159.0 FPS
2017 NVIDIA GeForce GTX 1080 Ti € 668
156.3 FPS
2019 AMD Radeon VII € 615
150.0 FPS
2019 AMD Radeon RX 5700 XT € 351
148.0 FPS
2018 NVIDIA GeForce RTX 2070 € 439
148.0 FPS
2019 AMD Radeon RX 5700 € 307
137.0 FPS
2019 NVIDIA GeForce RTX 2060 SUPER € 352
136.5 FPS
2016 NVIDIA GeForce GTX 1080 € 439
130.3 FPS
2019 NVIDIA GeForce RTX 2060 € 308
126.5 FPS
2017 AMD Radeon RX Vega 64 € 439
124.5 FPS
2017 NVIDIA GeForce GTX 1070 Ti € 360
123.5 FPS
2017 AMD Radeon RX Vega 56 € 351
120.5 FPS
2015 NVIDIA GeForce GTX TITAN X € 879
120.0 FPS
2019 NVIDIA GeForce GTX 1660 Ti € 246
118.6 FPS
2016 NVIDIA GeForce GTX 1070 € 351
114.7 FPS
2019 NVIDIA GeForce GTX 1660 SUPER € 202
114.0 FPS
2019 NVIDIA GeForce GTX 1660 € 194
110.0 FPS
2019 NVIDIA GeForce GTX 1650 SUPER € 141
94.5 FPS
2015 NVIDIA GeForce GTX 980 Ti € 571
93.8 FPS
2015 AMD Radeon R9 FURY X € 571
92.2 FPS
2018 AMD Radeon RX 590 € 246
91.5 FPS
2015 AMD Radeon R9 Nano € 571
87.0 FPS
2014 NVIDIA GeForce GTX 980 € 483
85.0 FPS
2015 AMD Radeon R9 FURY € 483
82.4 FPS
2019 AMD Radeon RX 5500 XT 8GB € 175
82.4 FPS
2017 AMD Radeon RX 580 € 202
79.7 FPS
2016 NVIDIA GeForce GTX 1060 6GB € 224
78.0 FPS
2014 NVIDIA GeForce GTX TITAN BLACK € 879
77.7 FPS
2016 AMD Radeon RX 480 € 352
75.0 FPS
2016 NVIDIA GeForce GTX 1060 3GB € 150
75.0 FPS
2013 AMD Radeon HD 7990 € 879
74.7 FPS
2015 AMD Radeon R9 390X € 378
74.4 FPS
2019 AMD Radeon RX 5500 XT 4GB € 149
73.4 FPS
2013 NVIDIA GeForce GTX 780 Ti € 615
73.3 FPS
2017 AMD Radeon RX 570 € 149
73.0 FPS
2013 NVIDIA GeForce GTX TITAN € 879
72.3 FPS
2014 NVIDIA GeForce GTX 970 € 290
71.4 FPS
2013 AMD Radeon R9 290X € 483
70.5 FPS
2015 AMD Radeon R9 390 € 290
70.1 FPS
2019 NVIDIA GeForce GTX 1650 € 131
70.0 FPS
2013 AMD Radeon R9 290 € 351
65.7 FPS
2013 NVIDIA GeForce GTX 780 € 571
58.9 FPS

El GTX 1080 encuentra entre el RTX 2060 SUPER y el RTX 2060 , cayendo más lento que RTX 2060 SUPER en 4.8 % y más rápido que RTX 2060 en 3 %. Tiene un rendimiento relativo fuerte contra todas las tarjetas gráficas aquí. Aquellos que tienen un monitor de alta frecuencia de actualización disfrutarán de lo que GTX 1080 tiene para ofrecer, ya que promedia 130.3 fps. Es una llamada cercana entre la GTX 1080 y su rival RX Vega 64 por un pequeño margen. Además, la GTX 1080 también fue más rápida que la GTX 980 por un buen margen.

Rendimiento del juego Ultra calidad en la configuración

Cambiar la configuración de calidad

Resolución 1920x1080

1% Low [Min FPS] Average FPS
Yera Juego FotoGramas por segundo
2023 Resident Evil 4
78
87.5
2023 A Plague Tale: Requiem
53
59.7
2023 Hogwarts Legacy
46
51.7
2023 The Last of Us Part I
35
39.8
2023 Forspoken
41
46.1
2023 The Callisto Protocol
32
35.8
2023 Dead Space
53
59.7
2023 Baldur's Gate 3
63
70.8
2023 Armored Core VI
63
70.8
2023 Immortals of Aveum
28
31.8
2023 Ratchet and Clank Rift Apart
57
63.6
2023 Remnant II
32
35.8
2023 Star Wars Jedi: Survivor
42
47.7
2023 Atomic Heart
42
47.7
2023 Starfield
21
23.9
2022 Elden Ring
56
63.2
2022 God of War
53
59.9
2022 Overwatch 2
100
111.4
2022 F1 22
64
71.6
2022 Dying Light 2
60
67.6
2022 Total War: Warhammer III
60
67.6
2022 Spider-Man Remastered
100
111.3
2022 Call of Duty: Modern Warfare II
71
79.5
2021 Forza Horizon 5
54
60.6
2021 Halo Infinite
41
46.3
2021 Battlefield 2042
76
85.3
2021 Hitman 3
82
91.5
2021 Far Cry 6
76
85.1
2021 Guardians of the Galaxy
83
93.1
2020 Watch Dogs: Legion
84
93.8
2020 Assassin's Creed Valhalla
44
48.9
2020 Microsoft Flight Simulator
28
31.9
2020 Valorant
192
214.3
2020 Call of Duty: Black Ops Cold War
75
84.0
2020 Death Stranding
87
97.1
2020 Marvel's Avengers
56
63.2
2020 Godfall
85
94.5
2020 Cyberpunk 2077
44
48.9
2019 Apex Legends
105
117.0
2019 Anthem
67
75.4
2019 Far Cry New Dawn
99
110.5
2019 Resident Evil 2
118
131.6
2019 Metro Exodus
52
58.6
2019 World War Z
102
114.0
2019 Gears of War 5
76
85.3
2019 F1 2019
96
107.1
2019 GreedFall
86
96.4
2019 Borderlands 3
61
67.8
2019 Call of Duty Modern Warfare
117
130.3
2019 Red Dead Redemption 2
45
50.2
2019 Need For Speed: Heat
70
78.8
2018 Call of Duty: Black Ops 4
123
137.0
2018 F1 2018
104
116.6
2018 Far Cry 5
93
104.0
2018 Assassin's Creed Odyssey
53
59.8
2018 Final Fantasy XV
77
86.2
2018 Shadow of the Tomb Raider
81
91.0
2018 Forza Horizon 4
105
117.0
2018 Fallout 76
130
145.0
2018 Hitman 2
101
113.0
2018 Just Cause 4
76
84.7
2018 Monster Hunter: World
82
91.2
2018 Strange Brigade
123
137.5
2018 Battlefield V
108
121.0
2017 Dawn of War III
97
108.2
2017 Ghost Recon Wildlands
81
90.0
2017 Assassin's Creed Origins
72
81.0
2017 Shadow of War
95
105.8
2017 Total War: Warhammer II
73
82.1
2017 Wolfenstein II
126
140.8
2017 Destiny 2
139
155.0
2017 PlayerUnknown's Battlegrounds
85
95.0
2017 Fortnite Battle Royale
105
116.9
2017 Need For Speed: Payback
105
117.3
2017 For Honor
140
156.4
2017 Project CARS 2
99
110.8
2017 Forza Motorsport 7
120
134.2
2016 Ashes of the Singularity
73
81.2
2016 Deus Ex: Mankind Divided
67
75.0
2016 Ashes of the Singularity: Escalation
80
89.4
2016 Doom
160
178.7
2016 F1 2016
111
123.6
2016 Hitman
111
123.4
2016 Rise of the Tomb Raider
120
134.3
2016 The Division
91
101.6
2016 Total War: Warhammer
98
109.3
2016 Battlefield 1
128
142.4
2016 Overwatch
163
181.3
2016 Dishonored 2
72
80.8
2015 DiRT Rally
146
162.9
2015 Grand Theft Auto V
100
111.4
2015 The Witcher 3
93
103.9
2015 Rocket League
410
456.1
2015 Need For Speed
113
126.4
2015 Project CARS
109
121.2
2015 Rainbow Six Siege
199
221.5
2013 Crysis 3
102
113.6
2013 Battlefield 4
141
156.8
2012 Counter-Strike: Global Offensive
281
312.7
2009 League of Legends
527
586.4

Resolución 2560x1440

1% Low [Min FPS] Average FPS
Yera Juego FotoGramas por segundo
2023 Resident Evil 4
50
63.6
2023 A Plague Tale: Requiem
34
43.7
2023 Hogwarts Legacy
31
39.8
2023 The Last of Us Part I
24
30.2
2023 Forspoken
24
30.2
2023 The Callisto Protocol
20
25.5
2023 Dead Space
31
39.8
2023 Baldur's Gate 3
45
57.3
2023 Armored Core VI
45
57.3
2023 Immortals of Aveum
17
22.3
2023 Ratchet and Clank Rift Apart
34
43.7
2023 Remnant II
19
23.9
2023 Star Wars Jedi: Survivor
28
35.8
2023 Atomic Heart
27
34.2
2023 Starfield
17
21.5
2022 Elden Ring
39
49.9
2022 God of War
41
51.5
2022 Overwatch 2
76
95.8
2022 F1 22
34
43.7
2022 Dying Light 2
34
43.7
2022 Total War: Warhammer III
38
47.7
2022 Spider-Man Remastered
63
79.5
2022 Call of Duty: Modern Warfare II
41
51.7
2021 Forza Horizon 5
41
52.1
2021 Halo Infinite
33
41.7
2021 Battlefield 2042
45
56.7
2021 Hitman 3
52
65.2
2021 Far Cry 6
50
63.6
2021 Guardians of the Galaxy
52
66.0
2020 Watch Dogs: Legion
48
61.2
2020 Assassin's Creed Valhalla
33
42.3
2020 Microsoft Flight Simulator
22
28.0
2020 Valorant
140
175.3
2020 Call of Duty: Black Ops Cold War
52
65.8
2020 Death Stranding
60
75.3
2020 Marvel's Avengers
36
45.0
2020 Godfall
50
63.2
2020 Cyberpunk 2077
36
45.6
2019 Apex Legends
69
87.1
2019 Anthem
47
59.8
2019 Far Cry New Dawn
68
85.8
2019 Resident Evil 2
70
88.6
2019 Metro Exodus
36
45.6
2019 World War Z
66
83.2
2019 Gears of War 5
49
61.9
2019 F1 2019
60
75.8
2019 GreedFall
55
69.7
2019 Borderlands 3
38
47.6
2019 Call of Duty Modern Warfare
75
93.8
2019 Red Dead Redemption 2
32
41.0
2019 Need For Speed: Heat
49
61.9
2018 Call of Duty: Black Ops 4
63
79.0
2018 F1 2018
74
93.0
2018 Far Cry 5
64
81.0
2018 Assassin's Creed Odyssey
35
44.0
2018 Final Fantasy XV
50
62.7
2018 Shadow of the Tomb Raider
49
62.0
2018 Forza Horizon 4
78
98.0
2018 Fallout 76
80
101.0
2018 Hitman 2
59
74.0
2018 Just Cause 4
50
62.5
2018 Monster Hunter: World
51
63.8
2018 Strange Brigade
76
95.8
2018 Battlefield V
77
97.0
2017 Dawn of War III
68
86.0
2017 Ghost Recon Wildlands
53
67.1
2017 Assassin's Creed Origins
51
64.0
2017 Shadow of War
55
69.8
2017 Total War: Warhammer II
46
58.1
2017 Wolfenstein II
77
96.4
2017 Destiny 2
106
133.0
2017 PlayerUnknown's Battlegrounds
57
72.0
2017 Fortnite Battle Royale
61
76.3
2017 Need For Speed: Payback
67
84.7
2017 For Honor
72
91.2
2017 Project CARS 2
62
78.2
2017 Forza Motorsport 7
96
121.2
2016 Ashes of the Singularity
57
72.1
2016 Deus Ex: Mankind Divided
41
52.2
2016 Ashes of the Singularity: Escalation
59
74.5
2016 Doom
99
124.7
2016 F1 2016
77
97.2
2016 Hitman
82
103.5
2016 Rise of the Tomb Raider
76
95.1
2016 The Division
58
73.2
2016 Total War: Warhammer
66
83.7
2016 Battlefield 1
82
102.9
2016 Overwatch
100
125.3
2016 Dishonored 2
55
69.1
2015 DiRT Rally
98
123.5
2015 Grand Theft Auto V
61
77.4
2015 The Witcher 3
61
77.2
2015 Rocket League
156
195.5
2015 Need For Speed
78
97.7
2015 Project CARS
74
92.5
2015 Rainbow Six Siege
114
143.3
2013 Crysis 3
58
72.5
2013 Battlefield 4
82
102.8
2012 Counter-Strike: Global Offensive
208
260.6
2009 League of Legends
260
325.8

Resolución 3440x1440

1% Low [Min FPS] Average FPS
Yera Juego FotoGramas por segundo
2019 Apex Legends
56
74.4
2019 Anthem
37
49.4
2019 Far Cry New Dawn
53
70.2
2019 Resident Evil 2
53
70.8
2019 Metro Exodus
30
39.8
2019 World War Z
53
70.1
2019 Gears of War 5
41
54.0
2019 F1 2019
50
66.3
2019 GreedFall
39
52.6
2019 Borderlands 3
29
38.7
2019 Call of Duty Modern Warfare
60
80.1
2019 Red Dead Redemption 2
27
35.9
2019 Need For Speed: Heat
41
54.0
2018 Call of Duty: Black Ops 4
46
61.0
2018 F1 2018
61
81.4
2018 Far Cry 5
50
65.8
2018 Assassin's Creed Odyssey
30
40.1
2018 Final Fantasy XV
39
52.1
2018 Shadow of the Tomb Raider
38
50.8
2018 Forza Horizon 4
66
87.2
2018 Fallout 76
63
84.0
2018 Hitman 2
47
63.1
2018 Just Cause 4
38
50.9
2018 Monster Hunter: World
38
50.5
2018 Strange Brigade
60
79.1
2018 Battlefield V
60
79.7
2017 Dawn of War III
53
70.1
2017 Ghost Recon Wildlands
43
57.2
2017 Assassin's Creed Origins
42
56.2
2017 Shadow of War
44
58.7
2017 Total War: Warhammer II
36
47.9
2017 Wolfenstein II
63
83.6
2017 Destiny 2
81
107.0
2017 PlayerUnknown's Battlegrounds
45
60.5
2017 Fortnite Battle Royale
47
62.5
2017 Need For Speed: Payback
58
76.7
2017 For Honor
55
73.2
2017 Project CARS 2
58
76.7
2017 Forza Motorsport 7
90
119.2
2016 Ashes of the Singularity
52
68.9
2016 Deus Ex: Mankind Divided
32
43.0
2016 Ashes of the Singularity: Escalation
55
72.5
2016 Doom
77
102.0
2016 F1 2016
64
85.2
2016 Hitman
66
88.0
2016 Rise of the Tomb Raider
58
77.3
2016 The Division
46
61.0
2016 Total War: Warhammer
53
70.4
2016 Battlefield 1
64
85.2
2016 Overwatch
77
101.5
2016 Dishonored 2
50
66.2
2015 DiRT Rally
78
102.7
2015 Grand Theft Auto V
46
61.5
2015 The Witcher 3
49
65.6
2015 Rocket League
116
153.4
2015 Need For Speed
66
87.1
2015 Project CARS
64
84.3
2015 Rainbow Six Siege
85
112.2
2013 Crysis 3
44
57.9
2013 Battlefield 4
72
95.1
2012 Counter-Strike: Global Offensive
201
264.9
2009 League of Legends
185
244.0

Resolución 3840x2160

1% Low [Min FPS] Average FPS
Yera Juego FotoGramas por segundo
2023 Resident Evil 4
33
47.7
2023 A Plague Tale: Requiem
19
27.8
2023 Hogwarts Legacy
19
27.8
2023 The Last of Us Part I
11
15.9
2023 Forspoken
10
14.3
2023 The Callisto Protocol
8
12.7
2023 Dead Space
11
15.9
2023 Baldur's Gate 3
22
31.8
2023 Armored Core VI
22
31.8
2023 Immortals of Aveum
7
10.3
2023 Ratchet and Clank Rift Apart
16
23.9
2023 Remnant II
8
11.9
2023 Star Wars Jedi: Survivor
12
17.5
2023 Atomic Heart
15
21.5
2023 Starfield
10
14.3
2022 Elden Ring
19
28.4
2022 God of War
28
40.0
2022 Overwatch 2
50
72.3
2022 F1 22
22
31.8
2022 Dying Light 2
22
31.8
2022 Total War: Warhammer III
25
35.8
2022 Spider-Man Remastered
38
55.7
2022 Call of Duty: Modern Warfare II
22
31.8
2021 Forza Horizon 5
28
40.4
2021 Halo Infinite
20
28.7
2021 Battlefield 2042
25
36.5
2021 Hitman 3
27
39.8
2021 Far Cry 6
23
34.2
2021 Guardians of the Galaxy
25
35.8
2020 Watch Dogs: Legion
27
39.8
2020 Assassin's Creed Valhalla
20
28.7
2020 Microsoft Flight Simulator
15
22.2
2020 Valorant
106
152.5
2020 Call of Duty: Black Ops Cold War
24
35.2
2020 Death Stranding
31
45.7
2020 Marvel's Avengers
16
23.6
2020 Godfall
21
30.1
2020 Cyberpunk 2077
21
30.0
2019 Apex Legends
36
52.0
2019 Anthem
22
32.5
2019 Far Cry New Dawn
31
45.5
2019 Resident Evil 2
30
43.7
2019 Metro Exodus
20
28.7
2019 World War Z
33
47.9
2019 Gears of War 5
27
39.1
2019 F1 2019
33
48.2
2019 GreedFall
20
28.7
2019 Borderlands 3
17
24.8
2019 Call of Duty Modern Warfare
39
56.0
2019 Red Dead Redemption 2
18
26.1
2019 Need For Speed: Heat
27
39.1
2018 Call of Duty: Black Ops 4
24
35.0
2018 F1 2018
41
59.1
2018 Far Cry 5
29
42.0
2018 Assassin's Creed Odyssey
21
31.0
2018 Final Fantasy XV
24
34.6
2018 Shadow of the Tomb Raider
23
33.0
2018 Forza Horizon 4
45
65.0
2018 Fallout 76
39
56.0
2018 Hitman 2
30
44.0
2018 Just Cause 4
22
32.6
2018 Monster Hunter: World
21
30.6
2018 Strange Brigade
36
52.1
2018 Battlefield V
36
52.0
2017 Dawn of War III
31
45.1
2017 Ghost Recon Wildlands
27
39.9
2017 Assassin's Creed Origins
28
41.0
2017 Shadow of War
27
39.9
2017 Total War: Warhammer II
21
31.4
2017 Wolfenstein II
41
59.8
2017 Destiny 2
46
67.0
2017 PlayerUnknown's Battlegrounds
28
41.0
2017 Fortnite Battle Royale
28
40.6
2017 Need For Speed: Payback
41
58.6
2017 For Honor
31
45.6
2017 Project CARS 2
45
65.1
2017 Forza Motorsport 7
71
101.6
2016 Ashes of the Singularity
39
56.6
2016 Deus Ex: Mankind Divided
19
28.2
2016 Ashes of the Singularity: Escalation
42
61.1
2016 Doom
46
66.0
2016 F1 2016
43
62.1
2016 Hitman
42
61.0
2016 Rise of the Tomb Raider
34
49.4
2016 The Division
28
40.8
2016 Total War: Warhammer
33
47.8
2016 Battlefield 1
39
56.4
2016 Overwatch
45
64.4
2016 Dishonored 2
38
54.7
2015 DiRT Rally
47
68.4
2015 Grand Theft Auto V
26
37.6
2015 The Witcher 3
31
45.4
2015 Rocket League
63
91.2
2015 Need For Speed
45
65.1
2015 Project CARS
45
65.1
2015 Rainbow Six Siege
46
66.5
2013 Crysis 3
25
35.8
2013 Battlefield 4
52
74.9
2012 Counter-Strike: Global Offensive
164
234.5
2009 League of Legends
91
130.3
GTX 1080 with i7-6700K at 1080p and Ultra calidad settings
GTX 1080 with i7-6700K at 1440p and Ultra calidad settings
GTX 1080 with i7-6700K at 4K and Ultra calidad settings

Compare contra competidores

GTX 1080 Especificaciones

GTX 1080 Board Design

Board NumberPG413 SKU 0
Length10.5 inches 267 mm
Outputs1x DVI1x HDMI3x DisplayPort
Power Connectors1x 8-pin
Slot WidthDual-slot
TDP180 W

GTX 1080 Clock Speeds

Boost Clock1733 MHz
GPU Clock1607 MHz
Memory Clock1251 MHz 10008 MHz effective

GTX 1080 Graphics Card

Bus InterfacePCIe 3.0 x16
GenerationGeForce 1000
Launch Price599 USD
ProductionActive
Release DateMay 27th, 2016

GTX 1080 Graphics Features

CUDA6.1
DirectX12.0 (12_1)
OpenCL1.2
OpenGL4.6
Shader Model6.1
Vulkan1.1.82

GTX 1080 Graphics Processor

ArchitecturePascal
Die Size314 mm²
GPU NameGP104
GPU VariantGP104-400-A1
Process Size16 nm
Transistors7,200 million

GTX 1080 Memory

Bandwidth320.3 GB/s
Memory Bus256 bit
Memory Size8192 MB
Memory TypeGDDR5X

GTX 1080 Render Config

ROPs64
SM Count20
Shading Units2560
TMUs160

GTX 1080 Theoretical Performance

FP16 (half) performance138.6 GFLOPS (1:64)
FP32 (float) performance8,873 GFLOPS
FP64 (double) performance277.3 GFLOPS (1:32)
Pixel Rate110.9 GPixel/s
Texture Rate277.3 GTexel/s

Critics Reviews

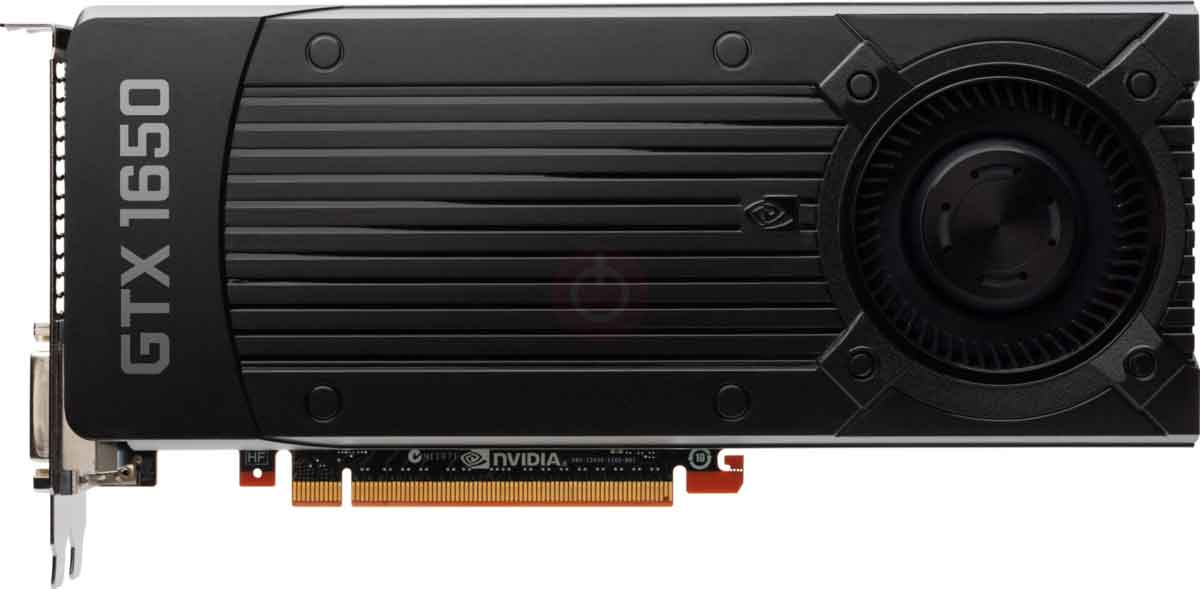
The NVIDIA GeForce GTX 1080 is the latest flagship GPU from NVIDIA, based on the company's Pascal architecture, targeted at hardcore gamers.
And the verdict is…well, it's close enough to call it a draw. ... Nvidia GeForce GTX 1080 review Pascal and the GTX 1080 deliver more performance and features, with greater efficiency. See ...
Nvidia GeForce GTX 1080 Founder’s Edition Review. Trending Today. ... The Verdict. Nvidia's new Pascal GPU exceeds expectations and has literally no competition in the upper echelon of GPU ...
Nvidia GeForce GTX 1080 – Performance and benchmark results Testing methodology Our test bench represents a fairly standard enthusiast gaming PC, with the following components in use.
Nvidia GeForce RTX 2080 vs Nvidia GeForce GTX 1080 architecture Back in 2016, the GTX 1080 was a showcase for Nvidia’s Pascal GPU architecture, which introduced the company’s 16nm FinFET process.
But prices for the GeForce GTX 1080 Ti—Nvidia’s powerful, previous-gen flagship—have started relaxing in recent weeks after spending most of 2018 inflated by wild cryptocurrency demand.
Nvidia will work with their usual AIB (add-in board) partner cards—Asus, EVGA, Gigabyte, MSI, PNY, Zotac, etc.—to offer GTX 1080 and GTX 1070 graphics cards.
The GeForce GTX SLI HB bridge doubles the available transfer bandwidth of the last-generation NVIDIA Maxwell architecture. Count on silky-smooth gameplay for the best surround gaming—only with NVIDIA TITAN Xp and GeForce GTX 1080 Ti, 1080, and 1070 graphics cards.
Nvidia GeForce GTX 1080 vs 980 Mike Jennings September 17, 2016 12:00 pm. Nvidia’s GTX 1080 is the world’s most powerful consumer GPU. A couple of years ago, the same could be said of the GTX ...
Nvidia GeForce GTX 1070 vs 1080 – Specs and Technology The two GTX cards share the same architecture, but they’re designed for different scenarios. The range-topping GTX 1080 is built for 4K ...

Discusión y Comentarios

Comparte tus comentarios
M
murreletrapunzel 6 years ago
980 TI to GTX 1080 ? is it worth it?is it worth upgrading? no VR , maybe 4 K setup.
0 1
S
synthesisgem 6 years ago
Personally, im keeping my 980 ti hybrid. I dont see any need to upgrade since it maxes 60 fps on all of my games at 1440p. I'd wait to see benchmarks tomorrow then make your decision.
0 0
A
acutenesspace 6 years ago
GTX 1080 or TITANCan anybody tell me which one is better?Thanks
0 0
A
awokepogo 6 years ago
Nothing major: My 6th machine.4790 , G1.Sniper B6 Board , 16 GB of HYPER RAM, C70 case with smoked window mod, RMX850W , Cryorig H7 cooler , GTX 1080 EVGA ACX 3.0 Gaming
1 0
S
sistonalumni 7 years ago
is a GTX 1080 Worth 30$ over the 1070ti ?should i go with the gtx 1080 if its costs 30$ more than the 1070ti ?
0 0
A
ancestorantarctic 7 years ago
$30 , if it's a comparative model cooling wise then yes absolutely.
0 0
R
revealoffended 7 years ago
GTX 1080 (normal) vs titan x pascalI have a gtx 1080 and i was wonderingAre 2 gtx 1080's stronger or weaker than 1 titan x
0 0
S
springsrock 7 years ago
What @Slumy_57 & @RobCrezz said. You're going to be at the mercy of SLI support in the games, & (unfortunately) the trend over the past couple of years is to let SLI support slide quite a bit (in a few games being so non-existent that SLI actually sees the performance drop).That being said...the Titan X (Pascal) & GTX 1080Ti are more powerful than your current 1080 (http://www.techspot.com/review/1352-nvidia-geforce-gtx-1080-ti/), but the question is whether the extra performance is truly worth it. Techspot's review says that, on average, the 1080TI provides ~20-24% more performance than the 1080. That's technically true; although the increase at 1080p resolutions is technically only ~13%, that's primarily because DOOM has a 200FPS framecap; both the GTX 1080 & 1080Ti hit the cap at 1080p, & while the GTX 1080 doesn't quite make it there, it's fairly close (177FPS), while the 1080Ti is still capped at 200. On the opposite end, even with the extra performance there were still a couple of games (Deus Ex: Mankind Divided & Mafia III) where the 4K performance still isn't quite at the "single GPU" level, & even on some of the other games you're not going to max out your 4K/60Hz monitor (the 1080Ti only had 60+ FPS at 4K in 10 of the 19 games).The biggest reason I can think of for possibly switching is to allow for smoother performance. That "20 to 24% improvement" figure pretty much holds true not only for the average FPS in the games but also the minimum FPS. When Techspot tested it, the GTX 1080Ti was able to maintain a minimum of 60FPS in all 19 games at 1440p, & 8 or 9 of the games at 4K (I say "8 or 9" because it was able to hit 59FPS minimum in Titanfall 2, which to me is close enough to include). So if your games aren't as smooth onscreen as you'd like, the 1080Ti will help out there.That being said...Unless you're going to sell your GTX 1080 & get some decent cash for it, buying a brand-new GTX 1080Ti just for a 25% performance improvement is basically just spending cash for bragging rights. If your system needs some improvements, the cash might be better spent on other parts.
0 0
S
stressvanquish 7 years ago
Nvidia geforce gtx titan x (pascal) or 1080 sliwhat graphics cards should I get. the titan x with pascal or 2 1080's for a 4k monitor.
0 0
D
dryeastward 7 years ago
1080 SLI will probably give you the best performance. This video shows a good comparison between them:https://www.youtube.com/watch?v=QWtqGNmWS3YThat said, not every application supports SLI or multi-GPU, so be careful.
0 1