RX 6650 XT benchmark with Ryzen Threadripper 1920X 1080p, 1440p, Ultrawide, 4K benchmarks at Low Quality

In terms of memory, the RX 6650 XT 's 8192 MB RAM is more than enough for modern games and should not cause any bottlenecks. The RX 6650 XT 's power requirements are reasonable and it is very efficient compared to the competition. This combination between RX 6650 XT and AMD Ryzen Threadripper 1920X has less than 8% bottleneck in many games and is perfect match to avoid FPS loss. 4K gaming is joyous on this RX 6650 XT , and with a little tweaking to your AA settings, it'd be hard to imagine a title not capable of 60 fps on average. This combination between RX 6650 XT and AMD Ryzen Threadripper 1920X is a perfect match to avoid FPS loss.

RX 6650 XT benchmark with Ryzen Threadripper 1920X 1080p, 1440p, Ultrawide, 4K benchmarks at Low Quality
AMD Radeon RX 6650 XT
Price $ 399.0
Year 2022
Maximum Recorded Temperature 72C
Max Fan Noise 48dB
Recommended Power Supply 450W
Benchmark CPU AMD Ryzen Threadripper 1920X ($419.99)
CPU Impact on FPS -34.7 FPS
CPU Impact on FPS % -20.0%
Benchmark Quality Settings Low Quality Settings
Average 1080p Performance 352.8 FPS
Average 1440p Performance 288.6 FPS
(Ultrawide) Average 1440p Performance 256.9 FPS
Average 4K Performance 195.9 FPS
Memory 8 GB
1080p Cost Per Frame $ 3.6
1440p Cost Per Frame $ 4.8
(Ultrawide) 1440p Cost Per Frame $ 5.7
4K Cost Per Frame $ 8.2
Series RX 6650 XT
Variant AMD Radeon RX 6650 XT
Overall Combination Score 93/100 Excellent

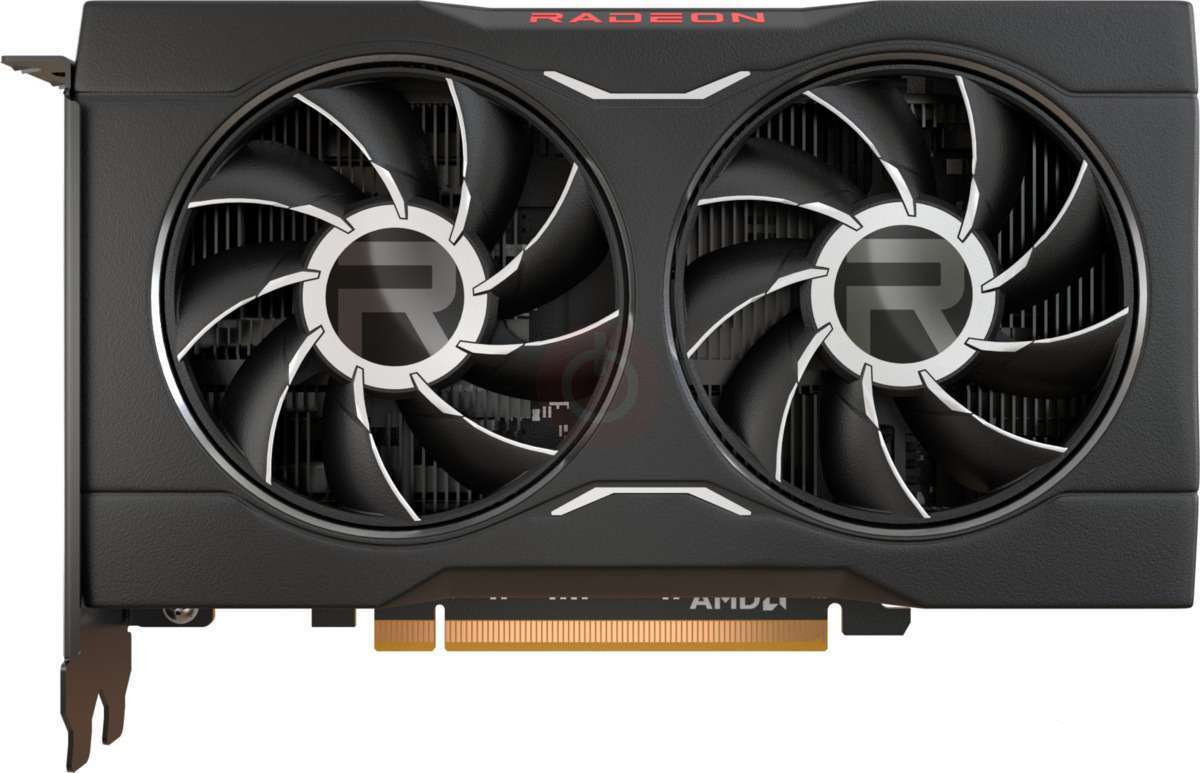
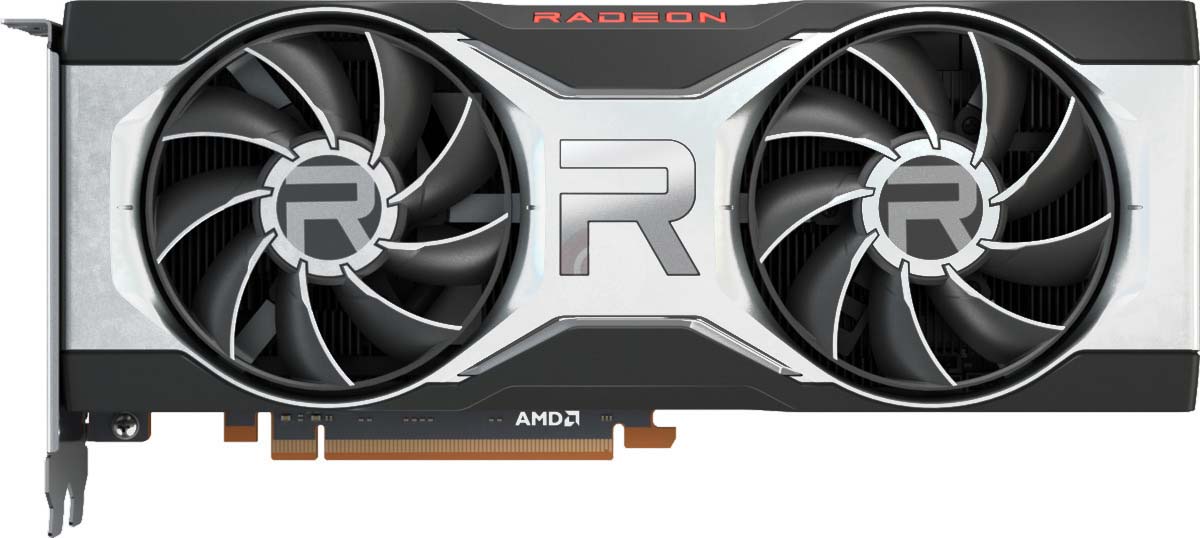
AMD ’s xx50 cards have always been defined by mid-range prices with performance that knocks on the door of high-end graphics cards – especially when overclocked. After taking the time to fully test the RDNA 2.0 graphics card inside the RX 6650 XT, we can say without a doubt that it continues the trend. The RX 6650 XT is much more expensive than the RX 5600 XT as it costs a whopping $ 399. Compare this to the RX 5600 XT, which came originally at a price of $ 279. Meanwhile, the NVIDIA closest equivalent card is the RTX 3060 which costs $ 329.

Spec for spec, this RX 6650 XT leapfrogs its direct predecessor, the RX 5600 XT, by boasting 36.8 % more fps. The RX 6650 XT has 8 GB RAM compared to the RX 5600 XT 's 6 GB video memory.

In our synthetic benchmarks, the RX 6650 XT blows past the RX 5600 XT and, amazingly, even the RX 5700 as well. Compared to its NVIDIA 's closest rival, RTX 3060, the RX 6650 XT was 16.4 % faster.

Fortunately, gaming performance was quite impressive. The RX 6650 XT consistently delivers great frame rate increases over the RX 5600 XT and it really justifies an upgrade. For 1080p Full HD, we were able to play Forspoken, Star Wars Jedi: Survivor, Atomic Heart, Halo Infinite, Assassin's Creed Valhalla at 61 fps to 68 fps and kept frame rates hovering around 64 fps.

For 1440p Quad HD, we were able to play Assassin's Creed Odyssey, Marvel's Avengers, Cyberpunk 2077, Total War: Warhammer III, Metro Exodus at 63 fps to 64 fps and kept frame rates hovering around 63 fps. For 2160p 4K, we were able to play Death Stranding, Far Cry 5, Resident Evil 4, F1 2019, Apex Legends at 62 fps to 67 fps and kept frame rates hovering around 64 fps.

Assassin's Creed Valhalla (2020)

Low Quality

Resolution 1920x1080

Year Graphics Card Price Frames Per Second
2020 AMD Radeon RX 6800 $ 579
308.2 FPS
2021 NVIDIA GeForce RTX 3070 Ti $ 599
294.0 FPS
2020 NVIDIA GeForce RTX 3070 $ 499
288.3 FPS
2023 NVIDIA GeForce RTX 4060 Ti 8 GB $ 399
277.0 FPS
2021 AMD Radeon RX 6700 XT $ 479
266.7 FPS
2020 NVIDIA GeForce RTX 3060 Ti $ 399
259.9 FPS
2023 NVIDIA GeForce RTX 4060 $ 299
256.1 FPS
2019 NVIDIA GeForce RTX 2080 SUPER $ 699
253.5 FPS
2022 AMD Radeon RX 6650 XT $ 399
209.6 FPS
2023 AMD Radeon RX 7600 $ 269
248.1 FPS
2021 AMD Radeon RX 6600 XT $ 379
234.4 FPS
2023 NVIDIA GeForce RTX 4050 $ 200
231.6 FPS
2019 NVIDIA GeForce RTX 2070 SUPER $ 499
228.8 FPS
2021 NVIDIA GeForce RTX 3060 $ 329
223.1 FPS
2019 AMD Radeon VII $ 699
218.3 FPS
2019 AMD Radeon RX 5700 XT $ 399
216.0 FPS
2019 AMD Radeon RX 5700 $ 349
204.0 FPS
2019 NVIDIA GeForce RTX 2060 SUPER $ 400
203.4 FPS
2020 AMD Radeon RX 5600 XT $ 279
192.5 FPS
2019 NVIDIA GeForce RTX 2060 $ 350
191.9 FPS
2021 NVIDIA GeForce RTX 3050 Ti $ 249
187.6 FPS
2019 NVIDIA GeForce GTX 1660 Ti $ 279
183.0 FPS
2021 NVIDIA GeForce RTX 3050 $ 200
181.4 FPS
2019 NVIDIA GeForce GTX 1660 SUPER $ 229
177.7 FPS
2019 NVIDIA GeForce GTX 1660 $ 220
172.9 FPS
2019 AMD Radeon RX 5500 XT 8GB $ 199
141.8 FPS
2019 NVIDIA GeForce GTX 1650 SUPER $ 160
133.8 FPS

The RX 6650 XT sits between the RTX 2080 SUPER and the RX 7600, falling slower than RTX 2080 SUPER by 1.1% and faster than RX 7600 by 1.1%. It has an average relative performance against every graphics card here. Its results are actually indistinguishable from those of the RTX 2080 SUPER. Those who have a high refresh rate monitor will enjoy what RX 6650 XT has to offer as it averages 209.56594991829 fps. Compared to its higher sibling, the RX 6650 XT was much slower than the RX 6700 XT by more than 20%.

Forza Horizon 4 (2018)

Low Quality

Resolution 1920x1080

Year Graphics Card Price Frames Per Second
2021 NVIDIA GeForce RTX 3070 Ti $ 599
519.6 FPS
2020 NVIDIA GeForce RTX 3070 $ 499
503.9 FPS
2020 AMD Radeon RX 6800 $ 579
481.8 FPS
2023 NVIDIA GeForce RTX 4060 Ti 8 GB $ 399
471.2 FPS
2023 NVIDIA GeForce RTX 4060 $ 299
430.8 FPS
2020 NVIDIA GeForce RTX 3060 Ti $ 399
430.6 FPS
2021 AMD Radeon RX 6700 XT $ 479
426.9 FPS
2019 NVIDIA GeForce RTX 2080 SUPER $ 699
423.1 FPS
2022 AMD Radeon RX 6650 XT $ 399
339.8 FPS
2023 AMD Radeon RX 7600 $ 269
399.3 FPS
2019 NVIDIA GeForce RTX 2070 SUPER $ 499
399.3 FPS
2023 NVIDIA GeForce RTX 4050 $ 200
397.3 FPS
2021 NVIDIA GeForce RTX 3060 $ 329
391.1 FPS
2021 AMD Radeon RX 6600 XT $ 379
376.5 FPS
2019 NVIDIA GeForce RTX 2060 SUPER $ 400
376.5 FPS
2019 AMD Radeon VII $ 699
360.9 FPS
2019 NVIDIA GeForce RTX 2060 $ 350
355.2 FPS
2019 AMD Radeon RX 5700 XT $ 399
352.1 FPS
2021 NVIDIA GeForce RTX 3050 Ti $ 249
343.9 FPS
2019 AMD Radeon RX 5700 $ 349
332.1 FPS
2019 NVIDIA GeForce GTX 1660 Ti $ 279
329.8 FPS
2020 AMD Radeon RX 5600 XT $ 279
328.0 FPS
2021 NVIDIA GeForce RTX 3050 $ 200
318.6 FPS
2019 NVIDIA GeForce GTX 1660 SUPER $ 229
316.3 FPS
2019 NVIDIA GeForce GTX 1660 $ 220
301.4 FPS
2019 NVIDIA GeForce GTX 1650 SUPER $ 160
268.0 FPS
2019 AMD Radeon RX 5500 XT 8GB $ 199
255.3 FPS

The RX 6650 XT sits between the RTX 2080 SUPER and the RX 7600, falling slower than RTX 2080 SUPER by 5.4% and faster than RX 7600 by 0.5%. It has an average relative performance against every graphics card here. Those who have a high refresh rate monitor will enjoy what RX 6650 XT has to offer as it averages 339.84237619487 fps. Compared to its higher sibling, the RX 6650 XT was much slower than the RX 6700 XT by more than 20%.

Cyberpunk 2077 (2020)

Low Quality

Resolution 1920x1080

Year Graphics Card Price Frames Per Second
2020 AMD Radeon RX 6800 $ 579
308.2 FPS
2021 NVIDIA GeForce RTX 3070 Ti $ 599
294.0 FPS
2020 NVIDIA GeForce RTX 3070 $ 499
288.3 FPS
2023 NVIDIA GeForce RTX 4060 Ti 8 GB $ 399
274.4 FPS
2021 AMD Radeon RX 6700 XT $ 479
266.7 FPS
2023 NVIDIA GeForce RTX 4060 $ 299
256.1 FPS
2020 NVIDIA GeForce RTX 3060 Ti $ 399
255.6 FPS
2019 NVIDIA GeForce RTX 2080 SUPER $ 699
253.5 FPS
2022 AMD Radeon RX 6650 XT $ 399
209.6 FPS
2023 AMD Radeon RX 7600 $ 269
248.1 FPS
2021 AMD Radeon RX 6600 XT $ 379
234.4 FPS
2023 NVIDIA GeForce RTX 4050 $ 200
231.6 FPS
2019 NVIDIA GeForce RTX 2070 SUPER $ 499
228.8 FPS
2021 NVIDIA GeForce RTX 3060 $ 329
223.1 FPS
2019 AMD Radeon VII $ 699
218.3 FPS
2019 AMD Radeon RX 5700 XT $ 399
216.0 FPS
2019 AMD Radeon RX 5700 $ 349
204.0 FPS
2019 NVIDIA GeForce RTX 2060 SUPER $ 400
203.4 FPS
2020 AMD Radeon RX 5600 XT $ 279
192.5 FPS
2019 NVIDIA GeForce RTX 2060 $ 350
191.9 FPS
2021 NVIDIA GeForce RTX 3050 Ti $ 249
187.6 FPS
2019 NVIDIA GeForce GTX 1660 Ti $ 279
183.0 FPS
2021 NVIDIA GeForce RTX 3050 $ 200
181.4 FPS
2019 NVIDIA GeForce GTX 1660 SUPER $ 229
177.7 FPS
2019 NVIDIA GeForce GTX 1660 $ 220
172.9 FPS
2019 AMD Radeon RX 5500 XT 8GB $ 199
141.8 FPS
2019 NVIDIA GeForce GTX 1650 SUPER $ 160
133.8 FPS

The RX 6650 XT sits between the RTX 2080 SUPER and the RX 7600, falling slower than RTX 2080 SUPER by 1.1% and faster than RX 7600 by 1.1%. It has an average relative performance against every graphics card here. Its results are actually indistinguishable from those of the RTX 2080 SUPER. Those who have a high refresh rate monitor will enjoy what RX 6650 XT has to offer as it averages 209.56594991829 fps. Compared to its higher sibling, the RX 6650 XT was much slower than the RX 6700 XT by more than 20%.

Grand Theft Auto V (2015)

Low Quality

Resolution 1920x1080

Year Graphics Card Price Frames Per Second
2021 NVIDIA GeForce RTX 3070 Ti $ 599
488.0 FPS
2020 NVIDIA GeForce RTX 3070 $ 499
473.0 FPS
2020 AMD Radeon RX 6800 $ 579
455.6 FPS
2023 NVIDIA GeForce RTX 4060 Ti 8 GB $ 399
447.7 FPS
2023 NVIDIA GeForce RTX 4060 $ 299
419.2 FPS
2020 NVIDIA GeForce RTX 3060 Ti $ 399
416.8 FPS
2019 NVIDIA GeForce RTX 2080 SUPER $ 699
409.3 FPS
2021 AMD Radeon RX 6700 XT $ 479
403.3 FPS
2019 NVIDIA GeForce RTX 2070 SUPER $ 499
387.0 FPS
2023 NVIDIA GeForce RTX 4050 $ 200
384.9 FPS
2021 NVIDIA GeForce RTX 3060 $ 329
380.8 FPS
2022 AMD Radeon RX 6650 XT $ 399
320.0 FPS
2023 AMD Radeon RX 7600 $ 269
378.7 FPS
2021 AMD Radeon RX 6600 XT $ 379
355.0 FPS
2019 NVIDIA GeForce RTX 2060 SUPER $ 400
352.8 FPS
2019 NVIDIA GeForce RTX 2060 $ 350
346.8 FPS
2019 AMD Radeon VII $ 699
340.7 FPS
2021 NVIDIA GeForce RTX 3050 Ti $ 249
334.8 FPS
2019 AMD Radeon RX 5700 XT $ 399
331.9 FPS
2019 NVIDIA GeForce GTX 1660 Ti $ 279
318.9 FPS
2019 AMD Radeon RX 5700 $ 349
312.5 FPS
2021 NVIDIA GeForce RTX 3050 $ 200
309.1 FPS
2020 AMD Radeon RX 5600 XT $ 279
304.3 FPS
2019 NVIDIA GeForce GTX 1660 SUPER $ 229
304.3 FPS
2019 NVIDIA GeForce GTX 1660 $ 220
291.3 FPS
2019 NVIDIA GeForce GTX 1650 SUPER $ 160
251.6 FPS
2019 AMD Radeon RX 5500 XT 8GB $ 199
231.9 FPS

The RX 6650 XT sits between the RTX 3060 and the RX 7600, falling slower than RTX 3060 by 0.6% and faster than RX 7600 by 0%. It has an average relative performance against every graphics card here. Its results are actually indistinguishable from those of the RTX 3060. Those who have a high refresh rate monitor will enjoy what RX 6650 XT has to offer as it averages 320.02888307321 fps. Against its rival - the RTX 3060, the RX 6650 XT is much slower. Compared to its higher sibling, the RX 6650 XT was much slower than the RX 6700 XT by more than 20%.

Call of Duty Modern Warfare (2019)

Low Quality

Resolution 1920x1080

Year Graphics Card Price Frames Per Second
2020 AMD Radeon RX 6800 $ 579
578.8 FPS
2021 NVIDIA GeForce RTX 3070 Ti $ 599
568.3 FPS
2020 NVIDIA GeForce RTX 3070 $ 499
551.6 FPS
2023 NVIDIA GeForce RTX 4060 Ti 8 GB $ 399
531.5 FPS
2021 AMD Radeon RX 6700 XT $ 479
515.4 FPS
2020 NVIDIA GeForce RTX 3060 Ti $ 399
505.0 FPS
2023 NVIDIA GeForce RTX 4060 $ 299
498.9 FPS
2019 NVIDIA GeForce RTX 2080 SUPER $ 699
495.5 FPS
2022 AMD Radeon RX 6650 XT $ 399
415.8 FPS
2023 AMD Radeon RX 7600 $ 269
485.2 FPS
2021 AMD Radeon RX 6600 XT $ 379
458.7 FPS
2023 NVIDIA GeForce RTX 4050 $ 200
458.7 FPS
2019 NVIDIA GeForce RTX 2070 SUPER $ 499
451.4 FPS
2021 NVIDIA GeForce RTX 3060 $ 329
440.2 FPS
2019 AMD Radeon VII $ 699
434.6 FPS
2019 AMD Radeon RX 5700 XT $ 399
430.8 FPS
2019 AMD Radeon RX 5700 $ 349
409.3 FPS
2019 NVIDIA GeForce RTX 2060 SUPER $ 400
408.3 FPS
2020 AMD Radeon RX 5600 XT $ 279
389.1 FPS
2019 NVIDIA GeForce RTX 2060 $ 350
388.0 FPS
2021 NVIDIA GeForce RTX 3050 Ti $ 249
382.8 FPS
2019 NVIDIA GeForce GTX 1660 Ti $ 279
371.5 FPS
2021 NVIDIA GeForce RTX 3050 $ 200
370.2 FPS
2019 NVIDIA GeForce GTX 1660 SUPER $ 229
361.6 FPS
2019 NVIDIA GeForce GTX 1660 $ 220
352.8 FPS
2019 NVIDIA GeForce GTX 1650 SUPER $ 160
317.4 FPS
2019 AMD Radeon RX 5500 XT 8GB $ 199
288.1 FPS

The RX 6650 XT sits between the RTX 2080 SUPER and the RX 7600, falling slower than RTX 2080 SUPER by 1.8% and faster than RX 7600 by 0.4%. It has an average relative performance against every graphics card here. Its results are actually indistinguishable from those of the RTX 2080 SUPER. Those who have a high refresh rate monitor will enjoy what RX 6650 XT has to offer as it averages 415.84531254988 fps. Compared to its higher sibling, the RX 6650 XT was much slower than the RX 6700 XT by more than 20%.

Game Performance at Low Quality settings

Change Quality Settings

Resolution 1920x1080

1% Low [Min FPS] Average FPS
Year Game Frames Per Second
2023 Resident Evil 4
242
309.6
2023 A Plague Tale: Requiem
184
235.0
2023 Hogwarts Legacy
165
211.3
2023 The Last of Us Part I
136
173.6
2023 Forspoken
152
194.1
2023 The Callisto Protocol
125
160.0
2023 Dead Space
184
235.0
2023 Baldur's Gate 3
208
266.2
2023 Armored Core VI
208
266.2
2023 Immortals of Aveum
114
146.3
2023 Ratchet and Clank Rift Apart
193
246.5
2023 Remnant II
125
160.0
2023 Star Wars Jedi: Survivor
156
199.2
2023 Atomic Heart
156
199.2
2023 Starfield
91
116.9
2022 Elden Ring
200
255.6
2022 God of War
191
244.9
2022 Overwatch 2
297
379.3
2022 F1 22
210
268.5
2022 Dying Light 2
201
257.5
2022 Total War: Warhammer III
201
257.5
2022 Spider-Man Remastered
287
366.3
2022 Call of Duty: Modern Warfare II
226
289.3
2021 Forza Horizon 5
193
247.0
2021 Halo Infinite
158
202.5
2021 Battlefield 2042
248
316.5
2021 Hitman 3
250
319.6
2021 Far Cry 6
237
303.6
2021 Guardians of the Galaxy
253
323.3
2020 Watch Dogs: Legion
255
325.4
2020 Assassin's Creed Valhalla
164
209.6
2020 Microsoft Flight Simulator
120
153.3
2020 Valorant
449
573.3
2020 Call of Duty: Black Ops Cold War
243
310.8
2020 Death Stranding
269
343.4
2020 Marvel's Avengers
198
253.5
2020 Godfall
263
336.4
2020 Cyberpunk 2077
164
209.6
2019 Apex Legends
319
408.1
2019 Anthem
220
281.8
2019 Far Cry New Dawn
288
367.6
2019 Resident Evil 2
331
423.5
2019 Metro Exodus
188
240.8
2019 World War Z
357
456.0
2019 Gears of War 5
245
312.7
2019 F1 2019
285
364.2
2019 GreedFall
266
339.8
2019 Borderlands 3
206
263.8
2019 Call of Duty Modern Warfare
325
415.8
2019 Red Dead Redemption 2
166
211.9
2019 Need For Speed: Heat
231
295.5
2018 Call of Duty: Black Ops 4
348
444.3
2018 F1 2018
340
434.0
2018 Far Cry 5
295
377.6
2018 Assassin's Creed Odyssey
190
242.9
2018 Final Fantasy XV
236
301.4
2018 Shadow of the Tomb Raider
265
338.3
2018 Forza Horizon 4
266
339.8
2018 Fallout 76
348
444.3
2018 Hitman 2
293
374.2
2018 Just Cause 4
246
314.6
2018 Monster Hunter: World
257
329.1
2018 Strange Brigade
337
431.0
2018 Battlefield V
330
421.9
2017 Dawn of War III
303
387.4
2017 Ghost Recon Wildlands
211
269.8
2017 Assassin's Creed Origins
186
238.6
2017 Shadow of War
290
371.0
2017 Total War: Warhammer II
236
301.4
2017 Wolfenstein II
403
515.2
2017 Destiny 2
336
429.6
2017 PlayerUnknown's Battlegrounds
230
293.5
2017 Fortnite Battle Royale
266
339.8
2017 Need For Speed: Payback
308
393.8
2017 For Honor
372
475.5
2017 Project CARS 2
295
377.6
2017 Forza Motorsport 7
336
429.6
2016 Deus Ex: Mankind Divided
250
320.0
2016 Ashes of the Singularity: Escalation
253
323.8
2016 Doom
429
547.5
2016 F1 2016
295
377.6
2016 Total War: Warhammer
288
367.6
2016 Battlefield 1
357
456.0
2016 Overwatch
359
458.7
2016 Dishonored 2
236
301.4
2015 Grand Theft Auto V
250
320.0
2015 Rocket League
663
847.1
2015 Need For Speed
323
412.7
2015 Project CARS
313
400.3
2015 Rainbow Six Siege
459
585.6
2012 Counter-Strike: Global Offensive
556
710.3
2009 League of Legends
726
926.8

Resolution 2560x1440

1% Low [Min FPS] Average FPS
Year Game Frames Per Second
2023 Resident Evil 4
193
246.5
2023 A Plague Tale: Requiem
146
186.4
2023 Hogwarts Legacy
136
173.6
2023 The Last of Us Part I
110
140.4
2023 Forspoken
110
140.4
2023 The Callisto Protocol
96
123.1
2023 Dead Space
136
173.6
2023 Baldur's Gate 3
178
228.0
2023 Armored Core VI
178
228.0
2023 Immortals of Aveum
86
110.5
2023 Ratchet and Clank Rift Apart
146
186.4
2023 Remnant II
91
116.9
2023 Star Wars Jedi: Survivor
125
160.0
2023 Atomic Heart
121
154.7
2023 Starfield
84
107.5
2022 Elden Ring
167
214.2
2022 God of War
171
218.6
2022 Overwatch 2
267
341.6
2022 F1 22
146
186.4
2022 Dying Light 2
146
186.4
2022 Total War: Warhammer III
156
199.2
2022 Spider-Man Remastered
226
289.3
2022 Call of Duty: Modern Warfare II
165
211.3
2021 Forza Horizon 5
173
220.9
2021 Halo Infinite
145
186.1
2021 Battlefield 2042
183
234.1
2021 Hitman 3
196
250.8
2021 Far Cry 6
193
246.5
2021 Guardians of the Galaxy
198
252.9
2020 Watch Dogs: Legion
187
239.7
2020 Assassin's Creed Valhalla
147
188.3
2020 Microsoft Flight Simulator
107
137.3
2020 Valorant
397
507.5
2020 Call of Duty: Black Ops Cold War
203
259.6
2020 Death Stranding
225
287.8
2020 Marvel's Avengers
155
198.0
2020 Godfall
198
253.5
2020 Cyberpunk 2077
155
198.0
2019 Apex Legends
265
338.3
2019 Anthem
186
238.6
2019 Far Cry New Dawn
240
307.0
2019 Resident Evil 2
252
321.9
2019 Metro Exodus
157
200.4
2019 World War Z
289
369.3
2019 Gears of War 5
193
247.0
2019 F1 2019
224
285.8
2019 GreedFall
211
269.8
2019 Borderlands 3
160
204.9
2019 Call of Duty Modern Warfare
262
334.6
2019 Red Dead Redemption 2
143
183.6
2019 Need For Speed: Heat
193
247.0
2018 Call of Duty: Black Ops 4
259
330.9
2018 F1 2018
285
364.2
2018 Far Cry 5
250
320.0
2018 Assassin's Creed Odyssey
155
198.0
2018 Final Fantasy XV
188
240.8
2018 Shadow of the Tomb Raider
201
257.5
2018 Forza Horizon 4
236
301.4
2018 Fallout 76
278
355.7
2018 Hitman 2
219
280.0
2018 Just Cause 4
196
251.3
2018 Monster Hunter: World
201
257.5
2018 Strange Brigade
265
338.3
2018 Battlefield V
274
350.4
2017 Dawn of War III
266
339.8
2017 Ghost Recon Wildlands
195
249.2
2017 Assassin's Creed Origins
181
231.9
2017 Shadow of War
220
281.8
2017 Total War: Warhammer II
190
242.9
2017 Wolfenstein II
318
406.5
2017 Destiny 2
303
387.4
2017 PlayerUnknown's Battlegrounds
188
240.8
2017 Fortnite Battle Royale
195
249.2
2017 Need For Speed: Payback
246
314.6
2017 For Honor
257
329.1
2017 Project CARS 2
231
295.5
2017 Forza Motorsport 7
313
400.3
2016 Deus Ex: Mankind Divided
188
240.8
2016 Ashes of the Singularity: Escalation
224
285.8
2016 Doom
353
451.6
2016 F1 2016
280
357.4
2016 Total War: Warhammer
237
303.3
2016 Battlefield 1
298
381.0
2016 Overwatch
280
357.4
2016 Dishonored 2
211
269.8
2015 Grand Theft Auto V
195
249.2
2015 Rocket League
426
543.9
2015 Need For Speed
270
345.2
2015 Project CARS
262
334.6
2015 Rainbow Six Siege
351
448.6
2012 Counter-Strike: Global Offensive
504
643.1
2009 League of Legends
568
725.1

Resolution 3440x1440

1% Low [Min FPS] Average FPS
Year Game Frames Per Second
2019 Apex Legends
223
293.5
2019 Anthem
159
209.6
2019 Far Cry New Dawn
202
265.9
2019 Resident Evil 2
209
276.0
2019 Metro Exodus
137
181.1
2019 World War Z
248
327.5
2019 Gears of War 5
169
223.1
2019 F1 2019
197
259.6
2019 GreedFall
167
220.9
2019 Borderlands 3
131
173.6
2019 Call of Duty Modern Warfare
227
299.4
2019 Red Dead Redemption 2
124
163.6
2019 Need For Speed: Heat
169
223.1
2018 Call of Duty: Black Ops 4
209
276.0
2018 F1 2018
250
329.1
2018 Far Cry 5
212
280.0
2018 Assassin's Creed Odyssey
139
183.6
2018 Final Fantasy XV
159
209.6
2018 Shadow of the Tomb Raider
167
220.9
2018 Forza Horizon 4
212
280.0
2018 Fallout 76
236
310.8
2018 Hitman 2
187
247.0
2018 Just Cause 4
164
216.3
2018 Monster Hunter: World
164
216.3
2018 Strange Brigade
224
295.5
2018 Battlefield V
234
308.9
2017 Dawn of War III
227
299.4
2017 Ghost Recon Wildlands
173
227.7
2017 Assassin's Creed Origins
159
209.6
2017 Shadow of War
192
253.5
2017 Total War: Warhammer II
159
209.6
2017 Wolfenstein II
276
364.2
2017 Destiny 2
254
334.6
2017 PlayerUnknown's Battlegrounds
161
211.9
2017 Fortnite Battle Royale
164
216.3
2017 Need For Speed: Payback
223
293.5
2017 For Honor
214
281.8
2017 Project CARS 2
221
291.8
2017 Forza Motorsport 7
301
397.1
2016 Deus Ex: Mankind Divided
159
209.6
2016 Ashes of the Singularity: Escalation
214
281.8
2016 Doom
301
397.1
2016 F1 2016
250
329.1
2016 Total War: Warhammer
205
269.8
2016 Battlefield 1
254
334.6
2016 Overwatch
234
308.9
2016 Dishonored 2
197
259.6
2015 Grand Theft Auto V
162
214.2
2015 Rocket League
355
467.1
2015 Need For Speed
243
320.0
2015 Project CARS
237
312.7
2015 Rainbow Six Siege
289
381.0
2012 Counter-Strike: Global Offensive
493
649.0
2009 League of Legends
471
621.0

Resolution 3840x2160

1% Low [Min FPS] Average FPS
Year Game Frames Per Second
2023 Resident Evil 4
139
199.2
2023 A Plague Tale: Requiem
92
131.7
2023 Hogwarts Legacy
92
131.7
2023 The Last of Us Part I
59
84.6
2023 Forspoken
54
78.0
2023 The Callisto Protocol
49
70.3
2023 Dead Space
59
84.6
2023 Baldur's Gate 3
102
146.3
2023 Armored Core VI
102
146.3
2023 Immortals of Aveum
41
59.7
2023 Ratchet and Clank Rift Apart
81
116.9
2023 Remnant II
47
67.3
2023 Star Wars Jedi: Survivor
64
91.5
2023 Atomic Heart
75
107.5
2023 Starfield
54
78.0
2022 Elden Ring
98
140.1
2022 God of War
126
181.1
2022 Overwatch 2
196
280.0
2022 F1 22
102
146.3
2022 Dying Light 2
102
146.3
2022 Total War: Warhammer III
111
160.0
2022 Spider-Man Remastered
156
223.4
2022 Call of Duty: Modern Warfare II
102
146.3
2021 Forza Horizon 5
128
183.6
2021 Halo Infinite
98
140.1
2021 Battlefield 2042
118
168.8
2021 Hitman 3
121
173.6
2021 Far Cry 6
108
154.7
2021 Guardians of the Galaxy
111
160.0
2020 Watch Dogs: Legion
121
173.6
2020 Assassin's Creed Valhalla
94
134.5
2020 Microsoft Flight Simulator
78
111.6
2020 Valorant
320
457.2
2020 Call of Duty: Black Ops Cold War
110
158.3
2020 Death Stranding
136
195.6
2020 Marvel's Avengers
82
117.6
2020 Godfall
98
140.1
2020 Cyberpunk 2077
98
140.1
2019 Apex Legends
145
207.2
2019 Anthem
105
150.7
2019 Far Cry New Dawn
133
190.7
2019 Resident Evil 2
133
190.7
2019 Metro Exodus
96
137.3
2019 World War Z
171
244.9
2019 Gears of War 5
119
171.3
2019 F1 2019
141
202.5
2019 GreedFall
94
134.5
2019 Borderlands 3
84
120.5
2019 Call of Duty Modern Warfare
157
225.4
2019 Red Dead Redemption 2
88
126.0
2019 Need For Speed: Heat
119
171.3
2018 Call of Duty: Black Ops 4
123
176.1
2018 F1 2018
175
251.3
2018 Far Cry 5
138
198.0
2018 Assassin's Creed Odyssey
105
150.7
2018 Final Fantasy XV
107
153.3
2018 Shadow of the Tomb Raider
107
153.3
2018 Forza Horizon 4
154
220.9
2018 Fallout 76
157
225.4
2018 Hitman 2
128
183.6
2018 Just Cause 4
107
153.3
2018 Monster Hunter: World
101
145.2
2018 Strange Brigade
149
214.2
2018 Battlefield V
157
225.4
2017 Dawn of War III
152
218.6
2017 Ghost Recon Wildlands
125
178.6
2017 Assassin's Creed Origins
112
161.0
2017 Shadow of War
133
190.7
2017 Total War: Warhammer II
101
145.2
2017 Wolfenstein II
193
276.0
2017 Destiny 2
163
234.1
2017 PlayerUnknown's Battlegrounds
109
156.0
2017 Fortnite Battle Royale
109
156.0
2017 Need For Speed: Payback
165
236.3
2017 For Honor
136
195.6
2017 Project CARS 2
177
253.5
2017 Forza Motorsport 7
244
348.8
2016 Deus Ex: Mankind Divided
105
150.7
2016 Ashes of the Singularity: Escalation
171
244.9
2016 Doom
201
287.8
2016 F1 2016
183
261.7
2016 Total War: Warhammer
141
202.5
2016 Battlefield 1
171
244.9
2016 Overwatch
152
218.6
2016 Dishonored 2
156
223.1
2015 Grand Theft Auto V
107
153.3
2015 Rocket League
227
325.6
2015 Need For Speed
177
253.5
2015 Project CARS
177
253.5
2015 Rainbow Six Siege
181
259.6
2012 Counter-Strike: Global Offensive
417
596.6
2009 League of Legends
291
415.8
RX 6650 XT with Ryzen Threadripper 1920X at 1080p and Low Quality settings
RX 6650 XT with Ryzen Threadripper 1920X at 1440p and Low Quality settings
RX 6650 XT with Ryzen Threadripper 1920X at 4K and Low Quality settings

Compare Against Competitors

RX 6650 XT Specifications

RX 6650 XT Board Design

Board NumberD532
Outputs1x HDMI 2.13x DisplayPort 1.4a
Power Connectors1x 8-pin
Slot WidthDual-slot
Suggested PSU450 W
TDP176 W

RX 6650 XT Clock Speeds

Base Clock2055 MHz
Boost Clock2635 MHz
Game Clock2410 MHz
Memory Clock2190 MHz 17.5 Gbps effective

RX 6650 XT Graphics Card

Bus InterfacePCIe 4.0 x8
GenerationNavi II (RX 6000)
Launch Price399 USD
PredecessorNavi
ProductionActive
Release DateMay 10th, 2022
Reviews13 in our database
SuccessorNavi III

RX 6650 XT Graphics Features

DirectX12 Ultimate (12_2)
OpenCL2.1
OpenGL4.6
Shader Model6.7
Vulkan1.3

RX 6650 XT Graphics Processor

ArchitectureRDNA 2.0
Die Size237 mm²
FoundryTSMC
GPU NameNavi 23
GPU VariantNavi 23 KXT (215-130000136)
Graphics ProcessorNavi 23
Process Size7 nm
Transistors11,060 million

RX 6650 XT Memory

Bandwidth280.3 GB/s
Memory Bus128 bit
Memory Size8 GB
Memory TypeGDDR6

RX 6650 XT Render Config

Compute Units32
L0 Cache32 KB per WGP
L1 Cache128 KB per Array
L2 Cache2 MB
L3 Cache32 MB
ROPs64
RT Cores32
Shading Units2048
TMUs128

RX 6650 XT Theoretical Performance

FP16 (half) performance21.59 TFLOPS (2:1)
FP32 (float) performance10.79 TFLOPS
FP64 (double) performance674.6 GFLOPS (1:16)
Pixel Rate168.6 GPixel/s
Texture Rate337.3 GTexel/s

Critics Reviews


Discussion and Comments

Share Your Comments