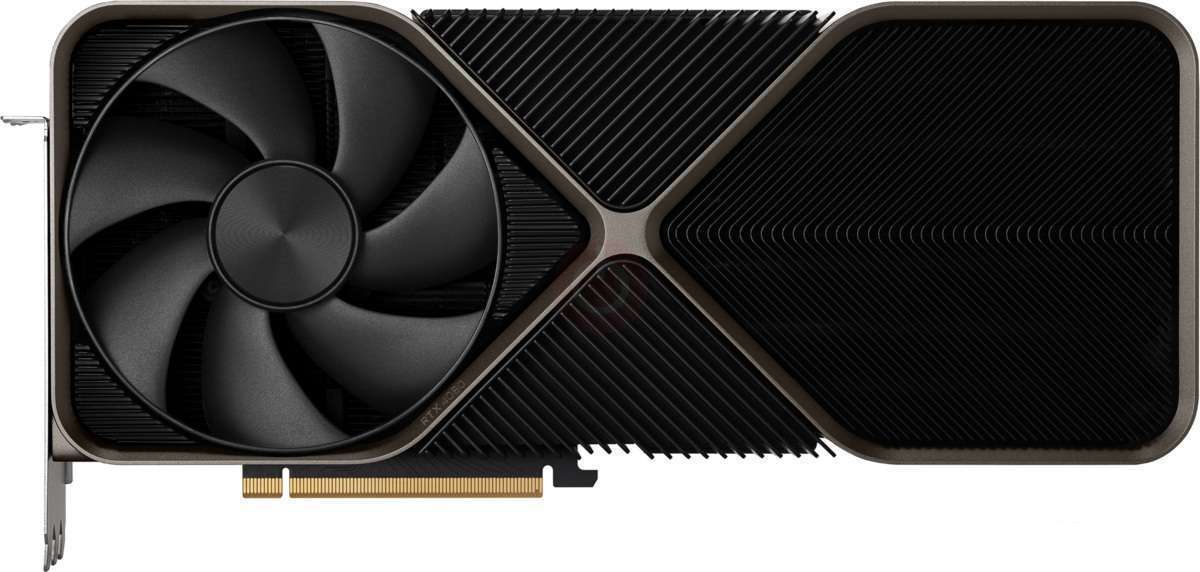
RTX 4080 Mit i3-8100 Benchmarks bei Geringe Qualität Qualitätseinstellungen
Was die Kosten angeht, so ist die Preisgestaltung hier eindeutig ein echtes Thema, und der Preis von RTX 4080 ist einfach lächerlich. Für diejenigen auf 1080p oder sogar 1440p Monitoren ist der RTX 4080 sehr teuer und es gibt kurzfristig bessere Wertzuwahlen. Es ist erwähnenswert, dass die RTX 4080 eine sehr stromhungrige Karte ist und eine anständige Stromversorgung benötigt. In Bezug auf den Speicher ist der RTX 4080 es 16384 MB RAM mehr als genug für moderne Spiele und sollte keine Engpässe verursachen. Diese Kombination zwischen RTX 4080 und Intel Core i3-8100 @ 3.60GHz hat in vielen Spielen weniger als 8% Engpass und passt perfekt zu FPS-Verlusten. 4K-Gaming ist fröhlich auf diesem RTX 4080 , und mit ein wenig Anpassung an Ihre AA-Einstellungen, wäre es schwer, sich einen Titel vorzustellen, der im Durchschnitt nicht in der Lage ist, 60 fps. Diese Kombination zwischen RTX 4080 und Intel Core i3-8100 @ 3.60GHz ist ein perfektes Spiel, um FPS-Verlust zu vermeiden.
The release year of the graphics card. The newer the better technology and performance optimization and
driver support.
Year
2016
2019
13
2015
2016
11
2014
2015
8
2013
2014
4
2007
2013
2
The price of the graphics card. The cheaper the better.
Price
0
250
35
250
400
30
400
550
25
550
650
15
650
9999
5
Power Supply Wattage required for overall system. The lower the better.
PSU
0
350
4
350
450
4
450
550
3
550
650
2
650
9999
1
Maximum recorded temperature under load. The lower the better for longer life of the graphics card.
Temp
0
70
2
70
75
2
75
80
1
80
85
1
85
999
1
Noise Levels under load. The lower the better.
Noise
0
45
2
45
48
2
48
50
2
50
55
1
55
999
1
Full HD performance at 1080p resolution. The higher the better.
FHD
60
9999
18
55
60
13
45
55
11
35
45
7
0
35
5
Quad HD performance at 1440p resolution. The higher the better.
QHD
60
9999
10
55
60
8
45
55
5
35
45
4
0
35
2
4K performance at 2160p resolution. The higher the better.
F4K
60
9999
5
55
60
4
45
55
3
35
45
2
0
35
1
Current CPU Impact on performance with respect to the highest performing CPU used for benchmark at the
time this graphics card was released.
CPU
-5
9999
5
-7
-5
4
-10
-7
3
-15
-10
2
-9999
-15
1
Graphics card memory (RAM) capacity. The higher the better for higher resolution textures and future
demanding games.
MEM
8
9999
5
4
8
4
2
4
3
1
2
2
0
1
1
FROM
TO
VERDICT
The overall score is determined based on the calculated weightings for the individual components.
OVERALL SCORE
80
99
Excellent
70
80
Very Good
60
70
Good
40
60
Acceptable
0
40
Weak
66/100
Gute
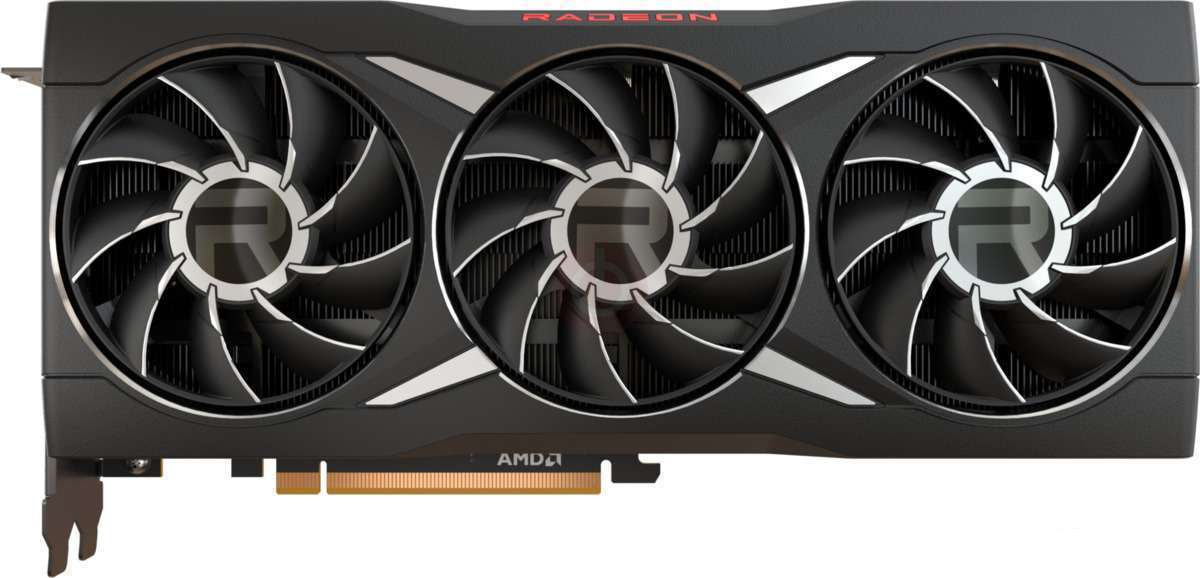
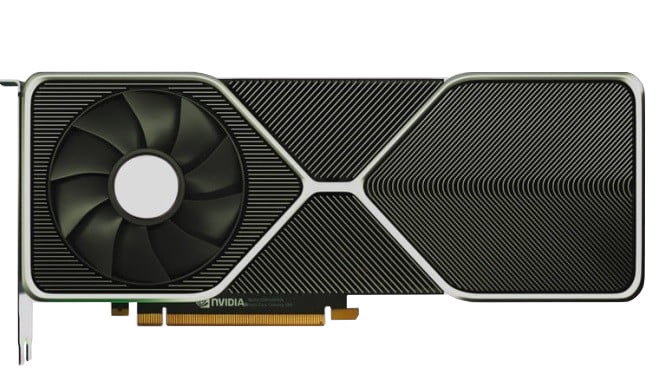
Spezifisch für RTX 3080 dieser RTX 4080 seinen direkten Vorgänger, den RTX 3080, indem er 32.8 % mehr fps 32.8. Der RTX 4080 hat 16 GB RAM im Vergleich zum 10 GB Videospeicher des RTX 3080.
In unseren synthetischen Benchmarks geht der RTX 4080 an RTX 3080, NVIDIA GeForce RTX 3080 Ti und erstaunlicherweise auch an RTX 3090. Glücklicherweise war die Spieleleistung ziemlich beeindruckend. Der RTX 4080 liefert durchweg großartige RTX 3080, NVIDIA GeForce RTX 3080 Ti gegenüber dem RTX 3080, NVIDIA GeForce RTX 3080 Ti und rechtfertigt wirklich ein Upgrade.
Für 1080p Full HD konnten wir Starfield, Microsoft Flight Simulator, Immortals of Aveum, The Callisto Protocol, Remnant II mit 69 fps bis 104 fps spielen und die 92 fps halten. Für 1440p Quad HD konnten wir Starfield, Immortals of Aveum, Remnant II, The Callisto Protocol, Microsoft Flight Simulator mit 63 fps bis 80 fps spielen und die 70 fps halten.
Für 2160p 4K konnten wir Atomic Heart, Microsoft Flight Simulator, Marvel's Avengers, Ratchet and Clank Rift Apart, Borderlands 3 mit 63 fps bis 80 fps spielen und die 68 fps halten.
Das RTX 4080 befindet sich zwischen dem RX 7900 XTX und dem RTX 4070 Ti und fällt um 1.4 % langsamer als RX 7900 XTX und um 3 % schneller als RTX 4070 Ti . Es hat hier eine starke relative Leistung gegenüber jeder Grafikkarte. Die Ergebnisse sind tatsächlich nicht von denen des RX 7900 XTX . Diejenigen, die einen Monitor mit hoher Bildwiederholfrequenz haben, werden das genießen, was RTX 4080 zu bieten hat, da es im Durchschnitt 355.22276109759 fps beträgt. Im Vergleich zu seinem höheren Geschwister, die RTX 4080 war viel langsamer als die RTX 4080 Ti um mehr als 20%.
Das RTX 4080 befindet sich zwischen dem RTX 4080 Ti und dem RTX 4070 Ti und fällt um 3.8 % langsamer als RTX 4080 Ti und um 2 % schneller als RTX 4070 Ti . Es hat hier eine starke relative Leistung gegenüber jeder Grafikkarte. Diejenigen, die einen Monitor mit hoher Bildwiederholfrequenz haben, werden das genießen, was RTX 4080 zu bieten hat, da es im Durchschnitt 625.47983740361 fps beträgt.
Das RTX 4080 befindet sich zwischen dem RX 7900 XTX und dem RTX 4070 Ti und fällt um 1.4 % langsamer als RX 7900 XTX und um 3 % schneller als RTX 4070 Ti . Es hat hier eine starke relative Leistung gegenüber jeder Grafikkarte. Die Ergebnisse sind tatsächlich nicht von denen des RX 7900 XTX . Diejenigen, die einen Monitor mit hoher Bildwiederholfrequenz haben, werden das genießen, was RTX 4080 zu bieten hat, da es im Durchschnitt 355.22276109759 fps beträgt. Im Vergleich zu seinem höheren Geschwister, die RTX 4080 war viel langsamer als die RTX 4080 Ti um mehr als 20%.
Das RTX 4080 befindet sich zwischen dem RTX 4080 Ti und dem RTX 4070 Ti und fällt um 4.1 % langsamer als RTX 4080 Ti und um 2.2 % schneller als RTX 4070 Ti . Es hat hier eine starke relative Leistung gegenüber jeder Grafikkarte. Diejenigen, die einen Monitor mit hoher Bildwiederholfrequenz haben, werden das genießen, was RTX 4080 zu bieten hat, da es im Durchschnitt 588.88802268143 fps beträgt.
Das RTX 4080 befindet sich zwischen dem RX 7900 XTX und dem RTX 4070 Ti und fällt um 0.8 % langsamer als RX 7900 XTX und um 1.9 % schneller als RTX 4070 Ti . Es hat hier eine starke relative Leistung gegenüber jeder Grafikkarte. Die Ergebnisse sind tatsächlich nicht von denen des RX 7900 XTX . Diejenigen, die einen Monitor mit hoher Bildwiederholfrequenz haben, werden das genießen, was RTX 4080 zu bieten hat, da es im Durchschnitt 678.07312544664 fps beträgt.
Spielperformance bei Geringe Qualität Einstellungen


Was ist vor dem Kauf einer Grafikkarte zu beachten?
Wenn Sie vorhaben, Ihr System durch den Kauf einer neuen Grafikkarte zu aktualisieren. Dann sind einige wichtige Faktoren zu beachten.
Auflösung VS Qualität: Auswirkungen auf die Spieleleistung
Was beeinflusst die Spieleleistung? Klarheit oder Details?
Ultra VS High-Quality-Einstellungen in PC-Spielen
Jeder Spieler hat eine andere Vorstellung von der idealen Einstellung für PC-Spiele. In den meisten Fällen entscheiden Sie sich jedoch für eine qualitativ hochwertige Grafikkonfiguration.
Was sind CPU- oder GPU-Engpässe?
Bekommst du plötzliche Bildstürze? Sie könnten einen Engpass haben.
Was ist die akzeptable FPS-Geschwindigkeit für mich?
Bei einigen Spielen können Sie bei niedrigeren Frameraten immer noch tolle Garphics genießen.
GPU Hierarchy
GPU Compare
CPU Compare
Gaming Laptops
Gaming Monitors
Gaming Headsets
Diskussion und Kommentare
Teilen Sie Ihre Kommentare