R9 390 dengan Core i3-11100 benchmark di Kualitas suara sedang pengaturan kualitas

Untuk sebagian besar, R9 390 masih mampu bermain game modern, tetapi Anda harus mengurangi pengaturan untuk mempertahankan framerates mereka lebih tinggi. Jika menjaga grafis kualitas pengaturan lebih dekat ke ultra atau tinggi penting, ada beberapa pilihan untuk upgrade. Tampaknya bahwa R9 390 lebih mampu mid-range kartu yang dapat bermain AAA judul di 1080 p dengan 60 frame per detik. It's worth dicatat bahwa R9 390 adalah kartu sangat kuasa lapar dan membutuhkan kabel listrik layak. Dalam memori, R9 390 's 8192 MB RAM lebih dari cukup untuk modern permainan dan tidak akan menyebabkan kemacetan yang ada.

 R9 390 dengan Core i3-11100 benchmark di Kualitas suara sedang pengaturan kualitas
AMD Radeon R9 390
Harga ₨ 6,779,862.8
Tahun 2015
Maksimum tercatat suhu 75C
Suara kipas Max 57.9dB
Direkomendasikan Power Supply 625W
Patokan CPU Intel Core i3-11100 ($122)
CPU dampak pada FPS + 0.6 FPS
CPU dampak pada FPS % 0.0%
Pengaturan kualitas patokan Medium Quality Settings
Rata-rata 1080p kinerja 144.8 FPS
Rata-rata 1440p kinerja 112.9 FPS
(Ultrawide) Rata-rata 1440p kinerja 98.2 FPS
Rata-rata 4K kinerja 71.8 FPS
Memori 8 GB
Biaya 1080p Per Bingkai ₨ 79,754.5
Biaya 1440p Per Bingkai ₨ 108,769.4
(Ultrawide) Biaya 1440p Per Bingkai ₨ 129,327.7
Biaya 4K Per Bingkai ₨ 189,544.6
Seri R9 390
Variant AMD Radeon R9 390
Keseluruhan kombinasi Skor 83/100 Sangat baik

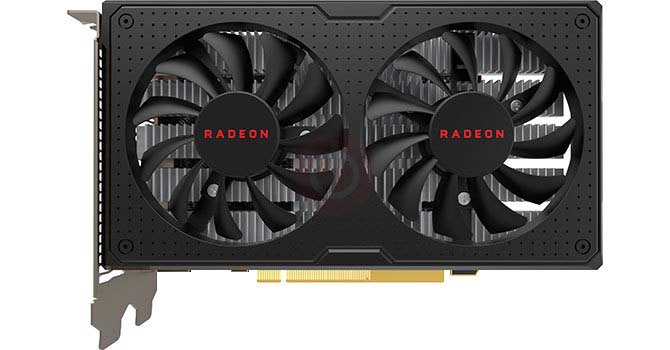
Berita baiknya adalah, dengan rilis R9 390X, harga R9 390 mendapatkan lebih banyak diskon. AMD 's xx90 kartu selalu ditentukan oleh harga high-end dengan kinerja yang mengetuk pintu extreme kartu grafis - terutama ketika overclock. Setelah meluangkan waktu untuk menguji sepenuhnya kartu grafis GCN 2.0 di dalam R9 390, kita dapat mengatakan tanpa ragu bahwa itu melanjutkan tren.

R9 390 jauh lebih murah daripada R9 290 karena biayanya ₨ 4796935.2. Bandingkan ini dengan R9 290, AMD Radeon R9 290X, yang awalnya dengan harga ₨ 5817559.7, ₨ 8004612.2. Sementara itu, NVIDIA kartu setara terdekat adalah GTX 980 yang harganya ₨ 8004612.2. Spec untuk spec, R9 390 melompati pendahulunya langsung, R9 290, dengan membual 3.3 % lebih banyak fps.

The R9 390 memiliki 8 GB RAM dibandingkan dengan R9 290 's 4 GB memori video. Dibandingkan dengan saingan terdekat NVIDIA, GTX 980, R9 390 adalah -19.1 % lebih lambat.

Untuk 1080p Full HD, kami dapat memainkan Apex Legends, Call of Duty Modern Warfare, Resident Evil 2, Strange Brigade, Valorant di 63 fps hingga 115 fps dan menjaga frame rate tetap di sekitar 79 fps. Untuk 1440p Quad HD, kami dapat memainkan Valorant di 94 fps hingga 94 fps dan menjaga frame rate tetap di sekitar 94 fps.

Untuk 2160p 4K, kami dapat memainkan Valorant di 82 fps hingga 82 fps dan menjaga frame rate tetap di sekitar 82 fps.

Assassin's Creed Valhalla (2020)

Kualitas suara sedang

Resolusi 1920x1080

Tahun Kartu grafis Harga Frame Per detik
2015 NVIDIA GeForce GTX 980 Ti ₨ 9,462,647
94.1 FPS
2015 AMD Radeon R9 FURY X ₨ 9,462,647
92.8 FPS
2018 AMD Radeon RX 590 ₨ 4,067,918
92.1 FPS
2015 AMD Radeon R9 Nano ₨ 9,462,647
88.4 FPS
2014 NVIDIA GeForce GTX 980 ₨ 8,004,612
86.9 FPS
2015 AMD Radeon R9 FURY ₨ 8,004,612
84.6 FPS
2017 AMD Radeon RX 580 ₨ 3,338,900
82.4 FPS
2016 NVIDIA GeForce GTX 1060 6GB ₨ 3,703,409
81.0 FPS
2016 AMD Radeon RX 480 ₨ 5,832,140
78.3 FPS
2016 NVIDIA GeForce GTX 1060 3GB ₨ 2,478,660
78.3 FPS
2015 AMD Radeon R9 390X ₨ 6,254,970
77.8 FPS
2013 NVIDIA GeForce GTX 780 Ti ₨ 10,191,665
76.9 FPS
2017 AMD Radeon RX 570 ₨ 2,464,079
76.7 FPS
2014 NVIDIA GeForce GTX 970 ₨ 4,796,935
75.3 FPS
2013 AMD Radeon R9 290X ₨ 8,004,612
74.4 FPS
2015 AMD Radeon R9 390 ₨ 4,796,935
74.6 FPS
2013 AMD Radeon R9 290 ₨ 5,817,560
70.2 FPS
2016 AMD Radeon RX 470 ₨ 2,609,883
69.5 FPS
2013 NVIDIA GeForce GTX 780 ₨ 9,462,647
64.2 FPS
2012 AMD Radeon HD 7970 GHz Edition ₨ 7,275,595
58.9 FPS
2015 AMD Radeon R9 380X ₨ 3,338,900
58.6 FPS
2013 AMD Radeon R9 280X ₨ 4,359,525
58.4 FPS
2013 NVIDIA GeForce GTX 770 ₨ 5,817,560
56.2 FPS
2016 NVIDIA GeForce GTX 1050 Ti ₨ 2,464,079
54.9 FPS
2012 NVIDIA GeForce GTX 680 ₨ 7,275,595
53.9 FPS
2014 AMD Radeon R9 285 ₨ 3,630,507
52.9 FPS
2015 AMD Radeon R9 380 ₨ 2,901,490
52.6 FPS
2014 AMD Radeon R9 280 ₨ 4,067,918
52.1 FPS
2015 NVIDIA GeForce GTX 960 ₨ 2,901,490
51.6 FPS
2012 NVIDIA GeForce GTX 670 ₨ 5,817,560
50.4 FPS
2013 NVIDIA GeForce GTX 760 ₨ 3,630,507
47.3 FPS
2012 AMD Radeon HD 7950 ₨ 6,546,577
45.7 FPS
2018 NVIDIA GeForce GTX 1050 ₨ 2,464,079
45.5 FPS
2012 NVIDIA GeForce GTX 660 Ti ₨ 4,359,525
44.9 FPS
2013 AMD Radeon R9 270 ₨ 2,609,883
44.7 FPS
2015 NVIDIA GeForce GTX 950 ₨ 2,318,276
43.4 FPS
2012 NVIDIA GeForce GTX 660 ₨ 3,338,900
40.7 FPS
2017 AMD Radeon RX 560 ₨ 1,443,455
40.4 FPS
2012 AMD Radeon HD 7850 ₨ 3,630,507
37.2 FPS

R9 390 berada di antara R9 290X dan R9 290 , jatuh lebih lambat dari R9 290X oleh 0.3 % dan lebih cepat dari R9 290 oleh 5.7 %. Ini memiliki kinerja relatif rata-rata terhadap setiap kartu grafis di sini. Hasilnya sebenarnya tidak bisa dibedakan dengan hasil dari R9 290X . Bila dibandingkan dengan saudara kandungnya yang lebih rendah - R9 380 - kita melihat kinerja lebih dari 20% lebih cepat untuk R9 390 .

Forza Horizon 4 (2018)

Kualitas suara sedang

Resolusi 1920x1080

Tahun Kartu grafis Harga Frame Per detik
2015 NVIDIA GeForce GTX 980 Ti ₨ 9,462,647
205.1 FPS
2018 AMD Radeon RX 590 ₨ 4,067,918
173.0 FPS
2014 NVIDIA GeForce GTX 980 ₨ 8,004,612
168.5 FPS
2016 NVIDIA GeForce GTX 1060 6GB ₨ 3,703,409
163.4 FPS
2017 AMD Radeon RX 580 ₨ 3,338,900
159.8 FPS
2015 AMD Radeon R9 FURY X ₨ 9,462,647
159.4 FPS
2016 NVIDIA GeForce GTX 1060 3GB ₨ 2,478,660
156.8 FPS
2014 NVIDIA GeForce GTX 970 ₨ 4,796,935
150.8 FPS
2015 AMD Radeon R9 Nano ₨ 9,462,647
150.1 FPS
2015 AMD Radeon R9 390X ₨ 6,254,970
138.6 FPS
2013 AMD Radeon R9 290 ₨ 5,817,560
130.8 FPS
2015 AMD Radeon R9 390 ₨ 4,796,935
129.9 FPS
2017 AMD Radeon RX 570 ₨ 2,464,079
128.9 FPS
2016 AMD Radeon RX 470 ₨ 2,609,883
114.8 FPS
2013 NVIDIA GeForce GTX 780 Ti ₨ 10,191,665
109.8 FPS
2013 NVIDIA GeForce GTX 780 ₨ 9,462,647
106.5 FPS
2015 AMD Radeon R9 380X ₨ 3,338,900
104.4 FPS
2015 AMD Radeon R9 380 ₨ 2,901,490
100.1 FPS
2015 NVIDIA GeForce GTX 960 ₨ 2,901,490
100.1 FPS
2016 NVIDIA GeForce GTX 1050 Ti ₨ 2,464,079
98.4 FPS
2013 AMD Radeon R9 290X ₨ 8,004,612
98.0 FPS
2012 NVIDIA GeForce GTX 680 ₨ 7,275,595
98.0 FPS
2012 NVIDIA GeForce GTX 670 ₨ 5,817,560
93.7 FPS
2018 NVIDIA GeForce GTX 1050 ₨ 2,464,079
90.2 FPS
2014 AMD Radeon R9 285 ₨ 3,630,507
87.1 FPS
2013 NVIDIA GeForce GTX 760 ₨ 3,630,507
86.0 FPS
2013 NVIDIA GeForce GTX 770 ₨ 5,817,560
83.5 FPS
2014 AMD Radeon R9 280 ₨ 4,067,918
80.3 FPS
2017 AMD Radeon RX 560 ₨ 1,443,455
80.3 FPS
2015 NVIDIA GeForce GTX 950 ₨ 2,318,276
79.0 FPS
2012 NVIDIA GeForce GTX 660 ₨ 3,338,900
67.3 FPS

R9 390 berada di antara R9 290 dan RX 570 , jatuh lebih lambat dari R9 290 oleh 1.5 % dan lebih cepat dari RX 570 oleh 0 %. Ini memiliki kinerja relatif rata-rata terhadap setiap kartu grafis di sini. Hasilnya sebenarnya tidak bisa dibedakan dengan hasil dari R9 290 . Mereka yang memiliki monitor dengan kecepatan refresh tinggi akan menikmati apa yang ditawarkan R9 390 karena rata 129.85723037134 rata 129.85723037134 fps. Terhadap saingannya - GTX 980 , R9 390 jauh lebih lambat. Bila dibandingkan dengan saudara kandungnya yang lebih rendah - R9 380 - kita melihat kinerja lebih dari 20% lebih cepat untuk R9 390 .

Cyberpunk 2077 (2020)

Kualitas suara sedang

Resolusi 1920x1080

Tahun Kartu grafis Harga Frame Per detik
2015 NVIDIA GeForce GTX 980 Ti ₨ 9,462,647
94.1 FPS
2015 AMD Radeon R9 FURY X ₨ 9,462,647
92.8 FPS
2018 AMD Radeon RX 590 ₨ 4,067,918
92.1 FPS
2015 AMD Radeon R9 Nano ₨ 9,462,647
88.4 FPS
2014 NVIDIA GeForce GTX 980 ₨ 8,004,612
86.9 FPS
2015 AMD Radeon R9 FURY ₨ 8,004,612
84.6 FPS
2017 AMD Radeon RX 580 ₨ 3,338,900
82.4 FPS
2016 NVIDIA GeForce GTX 1060 6GB ₨ 3,703,409
81.0 FPS
2016 AMD Radeon RX 480 ₨ 5,832,140
78.3 FPS
2016 NVIDIA GeForce GTX 1060 3GB ₨ 2,478,660
78.3 FPS
2015 AMD Radeon R9 390X ₨ 6,254,970
77.8 FPS
2013 NVIDIA GeForce GTX 780 Ti ₨ 10,191,665
76.9 FPS
2017 AMD Radeon RX 570 ₨ 2,464,079
76.7 FPS
2014 NVIDIA GeForce GTX 970 ₨ 4,796,935
75.3 FPS
2013 AMD Radeon R9 290X ₨ 8,004,612
74.4 FPS
2015 AMD Radeon R9 390 ₨ 4,796,935
74.6 FPS
2013 AMD Radeon R9 290 ₨ 5,817,560
70.2 FPS
2016 AMD Radeon RX 470 ₨ 2,609,883
69.5 FPS
2013 NVIDIA GeForce GTX 780 ₨ 9,462,647
64.2 FPS
2012 AMD Radeon HD 7970 GHz Edition ₨ 7,275,595
58.9 FPS
2015 AMD Radeon R9 380X ₨ 3,338,900
58.6 FPS
2013 AMD Radeon R9 280X ₨ 4,359,525
58.4 FPS
2013 NVIDIA GeForce GTX 770 ₨ 5,817,560
56.2 FPS
2016 NVIDIA GeForce GTX 1050 Ti ₨ 2,464,079
54.9 FPS
2012 NVIDIA GeForce GTX 680 ₨ 7,275,595
53.9 FPS
2014 AMD Radeon R9 285 ₨ 3,630,507
52.9 FPS
2015 AMD Radeon R9 380 ₨ 2,901,490
52.6 FPS
2014 AMD Radeon R9 280 ₨ 4,067,918
52.1 FPS
2015 NVIDIA GeForce GTX 960 ₨ 2,901,490
51.6 FPS
2012 NVIDIA GeForce GTX 670 ₨ 5,817,560
50.4 FPS
2013 NVIDIA GeForce GTX 760 ₨ 3,630,507
47.3 FPS
2012 AMD Radeon HD 7950 ₨ 6,546,577
45.7 FPS
2018 NVIDIA GeForce GTX 1050 ₨ 2,464,079
45.5 FPS
2012 NVIDIA GeForce GTX 660 Ti ₨ 4,359,525
44.9 FPS
2013 AMD Radeon R9 270 ₨ 2,609,883
44.7 FPS
2015 NVIDIA GeForce GTX 950 ₨ 2,318,276
43.4 FPS
2012 NVIDIA GeForce GTX 660 ₨ 3,338,900
40.7 FPS
2017 AMD Radeon RX 560 ₨ 1,443,455
40.4 FPS
2012 AMD Radeon HD 7850 ₨ 3,630,507
37.2 FPS

R9 390 berada di antara R9 290X dan R9 290 , jatuh lebih lambat dari R9 290X oleh 0.3 % dan lebih cepat dari R9 290 oleh 5.7 %. Ini memiliki kinerja relatif rata-rata terhadap setiap kartu grafis di sini. Hasilnya sebenarnya tidak bisa dibedakan dengan hasil dari R9 290X . Bila dibandingkan dengan saudara kandungnya yang lebih rendah - R9 380 - kita melihat kinerja lebih dari 20% lebih cepat untuk R9 390 .

Grand Theft Auto V (2015)

Kualitas suara sedang

Resolusi 1920x1080

Tahun Kartu grafis Harga Frame Per detik
2015 NVIDIA GeForce GTX 980 Ti ₨ 9,462,647
181.0 FPS
2015 AMD Radeon R9 FURY X ₨ 9,462,647
163.1 FPS
2018 AMD Radeon RX 590 ₨ 4,067,918
156.4 FPS
2014 NVIDIA GeForce GTX 980 ₨ 8,004,612
155.1 FPS
2015 AMD Radeon R9 Nano ₨ 9,462,647
148.4 FPS
2016 NVIDIA GeForce GTX 1060 6GB ₨ 3,703,409
147.1 FPS
2017 AMD Radeon RX 580 ₨ 3,338,900
144.4 FPS
2016 NVIDIA GeForce GTX 1060 3GB ₨ 2,478,660
141.1 FPS
2015 AMD Radeon R9 390X ₨ 6,254,970
140.8 FPS
2014 NVIDIA GeForce GTX 970 ₨ 4,796,935
137.1 FPS
2015 AMD Radeon R9 390 ₨ 4,796,935
136.7 FPS
2013 NVIDIA GeForce GTX 780 ₨ 9,462,647
126.9 FPS
2013 AMD Radeon R9 290 ₨ 5,817,560
126.3 FPS
2017 AMD Radeon RX 570 ₨ 2,464,079
125.5 FPS
2013 AMD Radeon R9 290X ₨ 8,004,612
120.3 FPS
2016 AMD Radeon RX 470 ₨ 2,609,883
120.3 FPS
2013 NVIDIA GeForce GTX 780 Ti ₨ 10,191,665
112.9 FPS
2015 AMD Radeon R9 380X ₨ 3,338,900
100.3 FPS
2012 NVIDIA GeForce GTX 680 ₨ 7,275,595
99.7 FPS
2015 AMD Radeon R9 380 ₨ 2,901,490
98.8 FPS
2012 NVIDIA GeForce GTX 670 ₨ 5,817,560
96.5 FPS
2015 NVIDIA GeForce GTX 960 ₨ 2,901,490
95.6 FPS
2014 AMD Radeon R9 285 ₨ 3,630,507
95.2 FPS
2014 AMD Radeon R9 280 ₨ 4,067,918
95.0 FPS
2016 NVIDIA GeForce GTX 1050 Ti ₨ 2,464,079
88.6 FPS
2013 NVIDIA GeForce GTX 770 ₨ 5,817,560
86.0 FPS
2013 NVIDIA GeForce GTX 760 ₨ 3,630,507
85.1 FPS
2018 NVIDIA GeForce GTX 1050 ₨ 2,464,079
81.2 FPS
2017 AMD Radeon RX 560 ₨ 1,443,455
76.5 FPS
2012 NVIDIA GeForce GTX 660 ₨ 3,338,900
71.3 FPS
2015 NVIDIA GeForce GTX 950 ₨ 2,318,276
70.9 FPS
2012 AMD Radeon HD 7850 ₨ 3,630,507
70.2 FPS

R9 390 berada di antara GTX 970 dan GTX 780 , jatuh lebih lambat dari GTX 970 oleh 1 % dan lebih cepat dari GTX 780 oleh 7 %. Ini memiliki kinerja relatif rata-rata terhadap setiap kartu grafis di sini. Hasilnya sebenarnya tidak bisa dibedakan dengan hasil dari GTX 970 . Mereka yang memiliki monitor dengan kecepatan refresh tinggi akan menikmati apa yang ditawarkan R9 390 karena rata 136.70730047092 rata 136.70730047092 fps. Bila dibandingkan dengan saudara kandungnya yang lebih rendah - R9 380 - kita melihat kinerja lebih dari 20% lebih cepat untuk R9 390 .

Call of Duty Modern Warfare (2019)

Kualitas suara sedang

Resolusi 1920x1080

Tahun Kartu grafis Harga Frame Per detik
2015 NVIDIA GeForce GTX 980 Ti ₨ 9,462,647
204.8 FPS
2015 AMD Radeon R9 FURY X ₨ 9,462,647
202.1 FPS
2018 AMD Radeon RX 590 ₨ 4,067,918
200.9 FPS
2015 AMD Radeon R9 Nano ₨ 9,462,647
193.2 FPS
2014 NVIDIA GeForce GTX 980 ₨ 8,004,612
189.8 FPS
2015 AMD Radeon R9 FURY ₨ 8,004,612
185.2 FPS
2017 AMD Radeon RX 580 ₨ 3,338,900
180.5 FPS
2016 NVIDIA GeForce GTX 1060 6GB ₨ 3,703,409
177.5 FPS
2016 AMD Radeon RX 480 ₨ 5,832,140
172.1 FPS
2016 NVIDIA GeForce GTX 1060 3GB ₨ 2,478,660
172.1 FPS
2015 AMD Radeon R9 390X ₨ 6,254,970
171.1 FPS
2013 NVIDIA GeForce GTX 780 Ti ₨ 10,191,665
169.1 FPS
2017 AMD Radeon RX 570 ₨ 2,464,079
168.5 FPS
2014 NVIDIA GeForce GTX 970 ₨ 4,796,935
165.6 FPS
2013 AMD Radeon R9 290X ₨ 8,004,612
164.0 FPS
2015 AMD Radeon R9 390 ₨ 4,796,935
164.4 FPS
2013 AMD Radeon R9 290 ₨ 5,817,560
155.1 FPS
2016 AMD Radeon RX 470 ₨ 2,609,883
153.5 FPS
2013 NVIDIA GeForce GTX 780 ₨ 9,462,647
142.3 FPS
2012 AMD Radeon HD 7970 GHz Edition ₨ 7,275,595
131.0 FPS
2015 AMD Radeon R9 380X ₨ 3,338,900
130.6 FPS
2013 AMD Radeon R9 280X ₨ 4,359,525
129.7 FPS
2013 NVIDIA GeForce GTX 770 ₨ 5,817,560
124.9 FPS
2016 NVIDIA GeForce GTX 1050 Ti ₨ 2,464,079
122.3 FPS
2012 NVIDIA GeForce GTX 680 ₨ 7,275,595
120.1 FPS
2014 AMD Radeon R9 285 ₨ 3,630,507
118.0 FPS
2015 AMD Radeon R9 380 ₨ 2,901,490
117.6 FPS
2014 AMD Radeon R9 280 ₨ 4,067,918
116.4 FPS
2015 NVIDIA GeForce GTX 960 ₨ 2,901,490
115.2 FPS
2012 NVIDIA GeForce GTX 670 ₨ 5,817,560
112.9 FPS
2013 NVIDIA GeForce GTX 760 ₨ 3,630,507
106.3 FPS
2012 AMD Radeon HD 7950 ₨ 6,546,577
102.5 FPS
2018 NVIDIA GeForce GTX 1050 ₨ 2,464,079
102.3 FPS
2012 NVIDIA GeForce GTX 660 Ti ₨ 4,359,525
101.2 FPS
2013 AMD Radeon R9 270 ₨ 2,609,883
100.1 FPS
2015 NVIDIA GeForce GTX 950 ₨ 2,318,276
97.6 FPS
2012 NVIDIA GeForce GTX 660 ₨ 3,338,900
91.5 FPS
2017 AMD Radeon RX 560 ₨ 1,443,455
91.3 FPS
2012 AMD Radeon HD 7850 ₨ 3,630,507
84.2 FPS

R9 390 berada di antara R9 290X dan R9 290 , jatuh lebih lambat dari R9 290X oleh 0.4 % dan lebih cepat dari R9 290 oleh 5.2 %. Ini memiliki kinerja relatif rata-rata terhadap setiap kartu grafis di sini. Hasilnya sebenarnya tidak bisa dibedakan dengan hasil dari R9 290X . Mereka yang memiliki monitor dengan kecepatan refresh tinggi akan menikmati apa yang ditawarkan R9 390 karena rata 164.35309810991 rata 164.35309810991 fps. Bila dibandingkan dengan saudara kandungnya yang lebih rendah - R9 380 - kita melihat kinerja lebih dari 20% lebih cepat untuk R9 390 .

Permainan kinerja di Kualitas suara sedang pengaturan

Mengubah pengaturan kualitas

Resolusi 1920x1080

1% Low [Min FPS] Average FPS
Tahun Permainan Frame Per detik
2023 Resident Evil 4
107
119.9
2023 A Plague Tale: Requiem
79
88.0
2023 Hogwarts Legacy
70
78.3
2023 The Last of Us Part I
56
63.0
2023 Forspoken
63
71.1
2023 The Callisto Protocol
52
57.9
2023 Dead Space
79
88.0
2023 Baldur's Gate 3
91
101.2
2023 Armored Core VI
91
101.2
2023 Immortals of Aveum
47
52.4
2023 Ratchet and Clank Rift Apart
83
92.6
2023 Remnant II
52
57.9
2023 Star Wars Jedi: Survivor
65
73.2
2023 Atomic Heart
65
73.2
2023 Starfield
36
41.0
2022 Elden Ring
82
92.1
2022 God of War
79
88.2
2022 Overwatch 2
130
145.4
2022 F1 22
91
102.0
2022 Dying Light 2
87
97.3
2022 Total War: Warhammer III
87
97.3
2022 Spider-Man Remastered
130
145.4
2022 Call of Duty: Modern Warfare II
99
111.1
2021 Forza Horizon 5
80
89.1
2021 Halo Infinite
64
71.3
2021 Battlefield 2042
105
117.4
2021 Hitman 3
111
124.3
2021 Far Cry 6
105
117.2
2021 Guardians of the Galaxy
113
126.1
2020 Watch Dogs: Legion
114
126.9
2020 Assassin's Creed Valhalla
67
74.6
2020 Microsoft Flight Simulator
47
52.6
2020 Valorant
217
241.6
2020 Call of Duty: Black Ops Cold War
104
116.0
2020 Death Stranding
117
130.3
2020 Marvel's Avengers
82
92.1
2020 Godfall
114
127.5
2020 Cyberpunk 2077
67
74.6
2019 Apex Legends
136
151.2
2019 Anthem
95
106.5
2019 Far Cry New Dawn
130
144.6
2019 Resident Evil 2
149
165.8
2019 Metro Exodus
77
86.6
2019 World War Z
127
141.9
2019 Gears of War 5
105
117.4
2019 F1 2019
126
140.8
2019 GreedFall
116
129.7
2019 Borderlands 3
87
97.6
2019 Call of Duty Modern Warfare
147
164.4
2019 Red Dead Redemption 2
68
76.5
2019 Need For Speed: Heat
99
110.2
2018 Forza Horizon 4
116
129.9
2018 Fallout 76
129
143.4
2018 Hitman 2
105
117.6
2018 Just Cause 4
105
116.8
2018 Monster Hunter: World
111
124.1
2018 Strange Brigade
154
171.6
2017 PlayerUnknown's Battlegrounds
107
119.7
2017 Fortnite Battle Royale
116
129.5
2017 Need For Speed: Payback
136
151.4
2017 For Honor
170
189.6
2017 Project CARS 2
130
144.8
2017 Forza Motorsport 7
151
168.4
2016 Ashes of the Singularity
108
120.3
2016 Hitman
150
166.9
2016 Rise of the Tomb Raider
137
153.3
2016 The Division
118
131.6
2016 Overwatch
164
183.1
2016 Dishonored 2
101
112.5
2015 DiRT Rally
204
226.7
2015 Grand Theft Auto V
123
136.7
2015 The Witcher 3
113
126.3
2015 Total War: Attila
97
108.8
2015 Rocket League
378
420.4
2015 Need For Speed
144
160.5
2015 Project CARS
139
155.3
2015 Rainbow Six Siege
222
247.7
2014 Dragon Age: Inquisition
155
172.5
2014 GRID Autosport
191
212.8
2014 Shadow of Mordor
183
204.0
2014 The Talos Principle
197
219.4
2013 Crysis 3
134
149.1
2013 Battlefield 4
163
181.9
2012 Counter-Strike: Global Offensive
288
320.3
2009 League of Legends
450
500.6

Resolusi 2560x1440

1% Low [Min FPS] Average FPS
Tahun Permainan Frame Per detik
2023 Resident Evil 4
73
92.4
2023 A Plague Tale: Requiem
54
67.8
2023 Hogwarts Legacy
50
62.8
2023 The Last of Us Part I
40
50.1
2023 Forspoken
40
50.1
2023 The Callisto Protocol
34
43.4
2023 Dead Space
50
62.8
2023 Baldur's Gate 3
67
84.6
2023 Armored Core VI
67
84.6
2023 Immortals of Aveum
31
38.8
2023 Ratchet and Clank Rift Apart
54
67.8
2023 Remnant II
32
41.0
2023 Star Wars Jedi: Survivor
46
57.6
2023 Atomic Heart
44
55.4
2023 Starfield
30
37.7
2022 Elden Ring
60
75.5
2022 God of War
62
77.6
2022 Overwatch 2
102
128.3
2022 F1 22
54
67.8
2022 Dying Light 2
54
67.8
2022 Total War: Warhammer III
58
73.0
2022 Spider-Man Remastered
88
110.7
2022 Call of Duty: Modern Warfare II
62
77.8
2021 Forza Horizon 5
62
78.3
2021 Halo Infinite
52
65.2
2021 Battlefield 2042
67
83.9
2021 Hitman 3
75
94.3
2021 Far Cry 6
73
92.4
2021 Guardians of the Galaxy
76
95.2
2020 Watch Dogs: Legion
71
89.7
2020 Assassin's Creed Valhalla
52
66.1
2020 Microsoft Flight Simulator
37
47.0
2020 Valorant
165
206.3
2020 Call of Duty: Black Ops Cold War
75
95.0
2020 Death Stranding
84
105.9
2020 Marvel's Avengers
55
69.5
2020 Godfall
73
91.9
2020 Cyberpunk 2077
56
70.2
2019 Apex Legends
95
119.1
2019 Anthem
70
87.7
2019 Far Cry New Dawn
94
117.6
2019 Resident Evil 2
96
120.7
2019 Metro Exodus
56
70.2
2019 World War Z
88
110.0
2019 Gears of War 5
72
90.4
2019 F1 2019
85
106.5
2019 GreedFall
79
99.5
2019 Borderlands 3
58
72.7
2019 Call of Duty Modern Warfare
101
126.3
2019 Red Dead Redemption 2
51
64.5
2019 Need For Speed: Heat
72
90.4
2018 Forza Horizon 4
90
113.1
2018 Hitman 2
66
82.8
2018 Just Cause 4
72
91.0
2018 Monster Hunter: World
74
92.6
2018 Strange Brigade
102
128.3
2017 PlayerUnknown's Battlegrounds
77
96.3
2017 Fortnite Battle Royale
72
91.0
2017 Need For Speed: Payback
93
116.4
2017 For Honor
98
123.5
2017 Project CARS 2
87
109.2
2017 Forza Motorsport 7
123
154.8
2016 Ashes of the Singularity
89
111.9
2016 Hitman
107
134.4
2016 Rise of the Tomb Raider
93
117.0
2016 The Division
83
104.8
2016 Overwatch
108
135.9
2016 Dishonored 2
79
98.8
2015 DiRT Rally
138
172.7
2015 Grand Theft Auto V
82
103.3
2015 The Witcher 3
82
103.1
2015 Total War: Attila
65
82.1
2015 Rocket League
179
224.3
2015 Need For Speed
104
130.4
2015 Project CARS
99
124.9
2015 Rainbow Six Siege
141
176.6
2014 Dragon Age: Inquisition
103
128.9
2014 GRID Autosport
136
170.9
2014 Shadow of Mordor
112
140.4
2014 The Talos Principle
138
172.7
2013 Crysis 3
84
105.4
2013 Battlefield 4
106
133.4
2012 Counter-Strike: Global Offensive
223
278.8
2009 League of Legends
263
329.0

Resolusi 3440x1440

1% Low [Min FPS] Average FPS
Tahun Permainan Frame Per detik
2019 Apex Legends
79
105.0
2019 Anthem
57
75.1
2019 Far Cry New Dawn
76
100.1
2019 Resident Evil 2
76
100.8
2019 Metro Exodus
47
62.5
2019 World War Z
72
95.6
2019 Gears of War 5
61
80.8
2019 F1 2019
72
95.4
2019 GreedFall
60
79.0
2019 Borderlands 3
46
61.3
2019 Call of Duty Modern Warfare
84
111.3
2019 Red Dead Redemption 2
43
57.6
2019 Need For Speed: Heat
61
80.8
2018 Forza Horizon 4
78
102.9
2018 Hitman 2
55
73.0
2018 Just Cause 4
58
76.7
2018 Monster Hunter: World
58
76.5
2018 Strange Brigade
83
110.0
2017 PlayerUnknown's Battlegrounds
63
83.9
2017 Fortnite Battle Royale
58
77.6
2017 Need For Speed: Payback
81
107.3
2017 For Honor
78
103.5
2017 Project CARS 2
81
107.3
2017 Forza Motorsport 7
116
152.7
2016 Overwatch
87
115.0
2016 Dishonored 2
72
95.2
2015 Rocket League
141
185.9
2015 Need For Speed
90
119.1
2015 Project CARS
88
116.0
2015 Rainbow Six Siege
110
145.5
2012 Counter-Strike: Global Offensive
214
282.2
2009 League of Legends
201
265.3

Resolusi 3840x2160

1% Low [Min FPS] Average FPS
Tahun Permainan Frame Per detik
2023 Resident Evil 4
51
73.0
2023 A Plague Tale: Requiem
32
46.8
2023 Hogwarts Legacy
32
46.8
2023 The Last of Us Part I
20
29.1
2023 Forspoken
18
26.4
2023 The Callisto Protocol
16
23.8
2023 Dead Space
20
29.1
2023 Baldur's Gate 3
36
52.1
2023 Armored Core VI
36
52.1
2023 Immortals of Aveum
14
20.1
2023 Ratchet and Clank Rift Apart
28
40.7
2023 Remnant II
15
22.6
2023 Star Wars Jedi: Survivor
21
31.3
2023 Atomic Heart
26
37.4
2023 Starfield
18
26.4
2022 Elden Ring
33
47.5
2022 God of War
44
63.0
2022 Overwatch 2
71
102.3
2022 F1 22
36
52.1
2022 Dying Light 2
36
52.1
2022 Total War: Warhammer III
40
57.6
2022 Spider-Man Remastered
57
82.8
2022 Call of Duty: Modern Warfare II
36
52.1
2021 Forza Horizon 5
44
63.5
2021 Halo Infinite
33
47.8
2021 Battlefield 2042
40
58.4
2021 Hitman 3
43
62.8
2021 Far Cry 6
38
55.4
2021 Guardians of the Galaxy
40
57.6
2020 Watch Dogs: Legion
43
62.8
2020 Assassin's Creed Valhalla
33
47.8
2020 Microsoft Flight Simulator
26
38.3
2020 Valorant
129
185.1
2020 Call of Duty: Black Ops Cold War
39
56.7
2020 Death Stranding
49
70.4
2020 Marvel's Avengers
28
40.4
2020 Godfall
34
49.9
2020 Cyberpunk 2077
34
49.6
2019 Apex Legends
54
78.3
2019 Anthem
37
53.2
2019 Far Cry New Dawn
49
70.2
2019 Resident Evil 2
47
67.8
2019 Metro Exodus
33
47.8
2019 World War Z
48
69.9
2019 Gears of War 5
43
61.8
2019 F1 2019
51
73.4
2019 GreedFall
33
47.8
2019 Borderlands 3
29
42.0
2019 Call of Duty Modern Warfare
58
83.0
2019 Red Dead Redemption 2
30
44.1
2019 Need For Speed: Heat
43
61.8
2018 Forza Horizon 4
56
80.6
2018 Hitman 2
38
54.4
2018 Just Cause 4
37
53.2
2018 Monster Hunter: World
35
50.6
2018 Strange Brigade
54
78.3
2017 PlayerUnknown's Battlegrounds
43
61.8
2017 Fortnite Battle Royale
38
54.9
2017 Need For Speed: Payback
60
86.2
2017 For Honor
49
70.2
2017 Project CARS 2
65
93.9
2017 Forza Motorsport 7
94
134.6
2016 Overwatch
55
79.9
2016 Dishonored 2
57
81.5
2015 Rocket League
86
123.5
2015 Need For Speed
65
93.9
2015 Project CARS
65
93.9
2015 Rainbow Six Siege
66
95.6
2012 Counter-Strike: Global Offensive
180
257.4
2009 League of Legends
114
163.8
R9 390 with Core i3-11100 at 1080p and Kualitas suara sedang settings
R9 390 with Core i3-11100 at 1440p and Kualitas suara sedang settings
R9 390 with Core i3-11100 at 4K and Kualitas suara sedang settings

Membandingkan terhadap pesaing

R9 390 Spesifikasi

R9 390 Board Design

Board NumberC679
Length10.83 inches 275 mm
Outputs2x DVI1x HDMI1x DisplayPort
Power Connectors1x 6-pin + 1x 8-pin
Slot WidthDual-slot
TDP275 W

R9 390 Clock Speeds

GPU Clock1000 MHz
Memory Clock1500 MHz 6000 MHz effective

R9 390 Graphics Card

Bus InterfacePCIe 3.0 x16
GenerationPirate Islands (R9 300)
Launch Price329 USD
ProductionActive
Release DateJun 18th, 2015

R9 390 Graphics Features

DirectX12.0 (12_0)
OpenCL2
OpenGL4.5
Shader Model6
Vulkan1.1.82

R9 390 Graphics Processor

ArchitectureGCN 2.0
Die Size438 mm²
GPU NameGrenada
GPU VariantGrenada PRO (215-0880030)
Process Size28 nm
Transistors6,200 million

R9 390 Memory

Bandwidth384.0 GB/s
Memory Bus512 bit
Memory Size8192 MB
Memory TypeGDDR5

R9 390 Render Config

Compute Units40
ROPs64
Shading Units2560
TMUs160

R9 390 Theoretical Performance

FP32 (float) performance5,120 GFLOPS
FP64 (double) performance640.0 GFLOPS (1:8)
Pixel Rate64.00 GPixel/s
Texture Rate160.0 GTexel/s

Critics Reviews

Conclusion. In the end, drawing a sweeping conclusion is difficult when there’s no actual reference graphics card. The next best approach is evaluating cards from AMD’s partners.
The R9 390 is AMD's rival to the Nvidia GTX 970 that's ideal for 1440p gaming, but it draws a lot of power for the performance you get. ... AMD Radeon R9 390 – Under the Hood ... Verdict. Given ...
AMD Radeon R9 390X – Results Analysis. ... Verdict. The R9 390X is designed to take on the GTX 980, and it does an excellent job. It’s almost £50 cheaper than Nvidia’s card and, in many ...
AMD Radeon R9 380: Tonga Makes the Switch from R9 285 to R9 380 Antigua Pro (previously called Tonga ) makes a reappearance as well in the Radeon R9 380. This card is another rebrand, plain and ...
The Radeon R9 390 and Radeon R9 390 are positioned against the GeForce GTX 980 and GeForce GTX 970. The R9 390X is a bit slower than the GeForce GTX 980 but features a larger VRAM and has a lower ...
The R9 390 is AMD's rival to the Nvidia GTX 970 that's ideal for 1440p gaming, but it draws a lot of power for the performance you get.
Radeon R9 390 Series: Return To Hawaii. Last but not least among the numbered 300 series stack are the top two cards and the only cards not to exist in some form in the OEM lineup, the R9 390 and ...
AMD is pleased to bring you the new R9 390 series which has been in development for a little over a year now. To clarify, the new R9 390 comes standard with 8GB of GDDR5 memory and outpaces the 290X.

Diskusi dan Komentar

Bagikan Komentar Anda