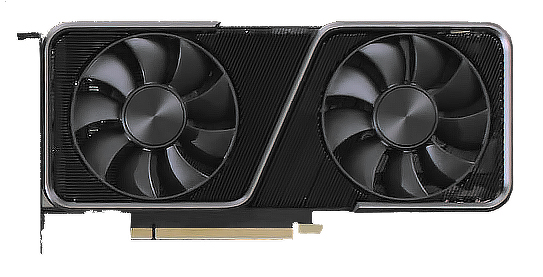
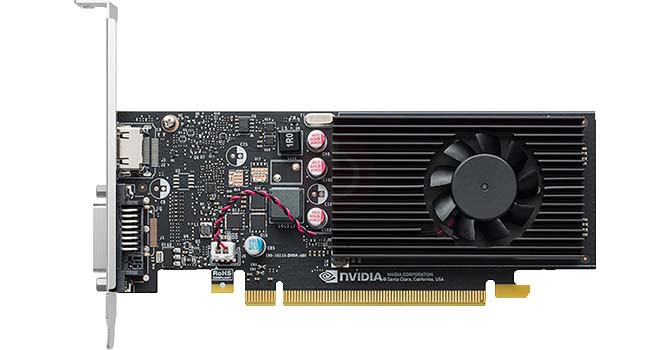
Valorant Game Performance Benchmarks Comparison - between RTX 3050 with Core i9-10900K and GT 1030 with i7-7700K - at Ultra, High, Medium, and Low Quality Settings with 1080p, 1440p, Ultrawide, 4K resolutions
RTX 3050 with Core i9-10900K
GT 1030 with i7-7700K
Ultra Quality
| Resolution |
Frames Per Second |
| 1080p |
|
| 1080p |
|
| 1440p |
|
| 1440p |
|
| 2160p |
|
| 2160p |
|
| w1440p |
|
| w1440p |
|
High Quality
| Resolution |
Frames Per Second |
| 1080p |
|
| 1080p |
|
| 1440p |
|
| 1440p |
|
| 2160p |
|
| 2160p |
|
| w1440p |
|
| w1440p |
|
Medium Quality
| Resolution |
Frames Per Second |
| 1080p |
|
| 1080p |
|
| 1440p |
|
| 1440p |
|
| 2160p |
|
| 2160p |
|
| w1440p |
|
| w1440p |
|
Low Quality
| Resolution |
Frames Per Second |
| 1080p |
|
| 1080p |
|
| 1440p |
|
| 1440p |
|
| 2160p |
|
| 2160p |
|
| w1440p |
|
| w1440p |
|
Compare Core i9-10900K vs i7-7700K


What to Consider Before Buying a Graphics Card
If you have been planning to upgrade your system by purchasing a new graphics card. Then there are some important factors to consider.
Resolution VS Quality: Impact on Game Performance
What affects game performance? Clarity or Details?
Ultra VS High Quality Settings in PC Games
Every player has a different notion about the ideal setting for PC games. But in most cases, opting for a High quality graphics configuration is the way to go.
What are CPU or GPU Bottlenecks?
Are you getting sudden frame drops? you might have a bottleneck.
What is the acceptable FPS speed for me?
For some games, you can still enjoy great garphics at lower frame rates.
GPU Hierarchy
GPU Compare
CPU Compare
Gaming Laptops
Gaming Monitors
Gaming Headsets
Discussion and Comments
Share Your Comments